LG 2004 Annual Report Download - page 84
Download and view the complete annual report
Please find page 84 of the 2004 LG annual report below. You can navigate through the pages in the report by either clicking on the pages listed below, or by using the keyword search tool below to find specific information within the annual report.-
 1
1 -
2
-
3
-
4
-
5
-
6
-
7
-
8
-
9
-
10
-
11
-
12
-
13
-
14
-
15
-
16
-
17
-
18
-
19
-
20
-
21
-
22
-
23
-
24
-
25
-
26
-
27
-
28
-
29
-
30
-
31
-
32
-
33
-
34
-
35
-
36
-
37
-
38
-
39
-
40
-
41
-
42
-
43
-
44
-
45
-
46
-
47
-
48
-
49
-
50
-
51
-
52
-
53
-
54
-
55
-
56
-
57
-
58
-
59
-
60
-
61
-
62
-
63
-
64
-
65
-
66
-
67
-
68
-
69
-
70
-
71
-
72
-
73
-
 74
74 -
 75
75 -
 76
76 -
 77
77 -
 78
78 -
 79
79 -
 80
80 -
 81
81 -
 82
82 -
 83
83 -
 84
84 -
 85
85 -
 86
86 -
 87
87 -
 88
88 -
 89
89 -
 90
90 -
 91
91 -
 92
92 -
 93
93 -
 94
94 -
95
-
96
-
97
-
98
-
99
-
100
-
101
-
102
-
103
-
104
-
105
-
106
-
107
-
108
-
109
-
110
-
111
-
112
-
113
-
114
-
115
-
116
-
117
-
118
-
119
-
120
-
121
-
122
-
123
-
124
-
125
-
126
-
127
-
128
-
129
 |
 |
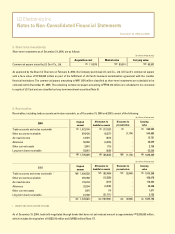
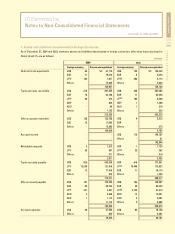
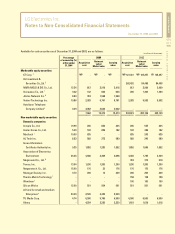
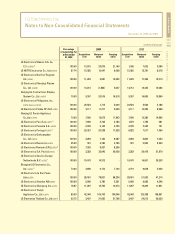
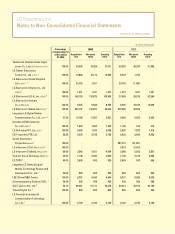
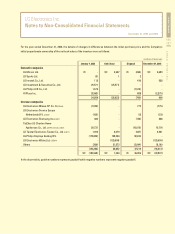
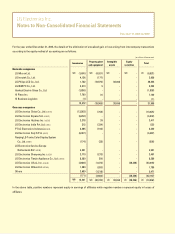
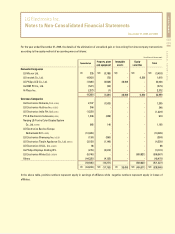
LG Electronics Inc.
Notes to Non-Consolidated Financial Statements
December 31, 2004 and 2003
(in millions of Korean won)
27,001
10,935
-
1,041
108,995
8,546
69,650
6,821
1,690
9,338
2,198
-
-
4,094
2,064
930
824
6,544
508
52,279
899
2,720
2004
16,369
12,174
7,501
1,041
134,835
9,846
149,207
11,067
1,690
7,543
2,198
-
-
5,651
2,040
902
824
6,544
508
51,711
899
2,720
59,205
19,846
34,723
1,041
148,109
6,035
963,757
10,188
1,690
5,084
9,636
-
-
3,246
1,736
2,699
824
8,201
508
68,487
899
2,720
100.00
100.00
100.00
100.00
100.00
100.00
100.00
51.00
100.00
100.00
38.20
100.00
100.00
60.00
40.00
40.00
49.00
100.00
50.00
42.74
100.00
100.00
Percentage
of ownership (%)
at December
31, 2004
Net asset
value
Acquisition
cost
Carrying
value
51,842
-
-
1,041
42,594
12,646
-
6,422
915
7,418
8,493
-
-
5,851
2,328
906
824
6,539
508
25,190
899
2,720
2003
46,334
1,700
(7,145)
1,041
36,918
13,319
46,059
6,422
916
7,833
8,493
(12,721)
21,503
5,953
2,316
930
824
6,539
508
25,190
899
2,720
59,205
8,439
20,792
1,041
37,985
6,035
676,082
9,669
1,155
2,920
9,636
487,215
4,673
3,246
1,736
2,699
824
8,201
508
29,001
899
2,720
Net asset
value
Acquisition
cost
Carrying
value
Taizhou LG-Chunlan Home Appli-
ances Co., Ltd.(LGETR) (formerly LGECT)
LG Taistar Electronics
Taiwan Co., Ltd. (LGETT) 4
LG Electronics United Kingdom
Ltd. (LGEUK) 1,4
LG Electronics Ukraine Co., Ltd.
(LGEUR) 2
LG Electronics U.S.A., Inc.(LGEUS) 8
LG Electronics Vietnam
Co., Ltd.(LGEVN)
LG Electronics Wales Ltd.(LGEWA) 4
Langchao LG Digital Mobile
Communication Co., Ltd. (LGEYT) 4
Kunshan LGMS Computer
Co., Ltd.(LGMSK) 4
LG Soft India PVT, Ltd. (LGSI) 4
EIC Properties PTE, Ltd.
Zenith Electronics
Corporation(Zenith) 8
LG Infocomm U.S.A. Inc.(LGICUS) 8
LG Infocomm Thailand, Inc.(LGICTH)
Vietnam Korea Exchange, Ltd.(V.K.X.)
LG TOPS 3
Langchao LG (Yantai) Digital
Mobile Technology Research &
Development Co., Ltd. 2
LGE (China) R&D Center
Electromagnetica Goldstar S.R.L. 2
SLD Telecom Pte. Ltd. 4
Triveni Digital Inc. 2
LG (Yantai) Information &
Communication Technology
Co., Ltd. 2