LG 2004 Annual Report Download - page 44
Download and view the complete annual report
Please find page 44 of the 2004 LG annual report below. You can navigate through the pages in the report by either clicking on the pages listed below, or by using the keyword search tool below to find specific information within the annual report.-
 1
1 -
2
-
3
-
4
-
5
-
6
-
7
-
8
-
9
-
10
-
11
-
12
-
13
-
14
-
15
-
16
-
17
-
18
-
19
-
20
-
21
-
22
-
23
-
24
-
25
-
26
-
27
-
28
-
29
-
30
-
31
-
32
-
33
-
 34
34 -
 35
35 -
 36
36 -
 37
37 -
 38
38 -
 39
39 -
 40
40 -
 41
41 -
 42
42 -
 43
43 -
 44
44 -
 45
45 -
 46
46 -
 47
47 -
 48
48 -
 49
49 -
 50
50 -
 51
51 -
 52
52 -
 53
53 -
 54
54 -
55
-
56
-
57
-
58
-
59
-
60
-
61
-
62
-
63
-
64
-
65
-
66
-
67
-
68
-
69
-
70
-
71
-
72
-
73
-
74
-
75
-
76
-
77
-
78
-
79
-
80
-
81
-
82
-
83
-
84
-
85
-
86
-
87
-
88
-
89
-
90
-
91
-
92
-
93
-
94
-
95
-
96
-
97
-
98
-
99
-
100
-
101
-
102
-
103
-
104
-
105
-
106
-
107
-
108
-
109
-
110
-
111
-
112
-
113
-
114
-
115
-
116
-
117
-
118
-
119
-
120
-
121
-
122
-
123
-
124
-
125
-
126
-
127
-
128
-
129
 |
 |

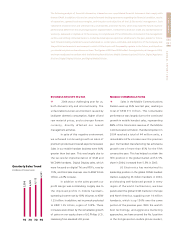
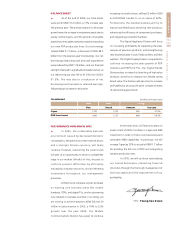
PROFITS
�This year our gross profit was almost
the same as last year. Sales and administrative
expenses however, increased 24%, while
marketing expenses grew due to the launching
of brand enhancement activities for major
products such as digital appliances and TVs. As
a result, our operating profit margin was 5.1%,
a slight decline from the previous year.
Considering the profits of each
division, the Mobile Communications Division
contributed more to the growth of the
Company's operating profit than any other
division. A full 47% of the Company's total
operating profit was produced by the Mobile
Communications. This was primarily due to
increased sales of WCDMA handsets, and the
timely launching of new handset models.
The Appliance Division made the largest
contribution to the Company's overall
operating profit in 2003. However, due to the
great improvement in sales revenue, as well as
profitability in the mobile handset business,
the Mobile Communications Division has
contributed the most to the Company's overall
operating profit in 2004.
Digital Appliance Division's operating
profit margin stood at 7.2%, contributing 33%
of our total operating profit. This division's
profitability was somewhat lower than in 2003
due to a steep increase in the value of the
Korean currency, elevated raw material prices,
and additional expenses associated with the
recall of rice cookers. However, our Digital
Appliance Division still maintained a higher than
average profitability when compared to other
home appliance companies around the globe.
Digital Display Division's profitability
was relatively low because of oversupply which
led to price declines in PDP modules and PDP
TVs, as well as increased marketing efforts
designed to extend this market's size. In the
Digital Media Division, optical storage business
profitability declined slightly from 2003. Profits
in the PC business however, improved due to
the phasing out of our low margin PC OEM
business. As a result, Digital Media Division's
operating profitability was 4.6% slightly higher
than in 2003.
LG Electronics’ recurring profit
skyrocketed to KRW 1.9 trillion, a 122% gain,
and net income rose 133% to KRW 1.6 trillion.
This increase in ordinary and net income is
largely attributable to gains from foreign
currency translations, caused by the elevated
value of the Korean currency, as well as by
equity method gains.
In particular, equity method gains in
2004 totaled 765 billion, a large increase over
2003. Due to large production volume
increases, and higher prices caused by a
shortage of TFT-LCD supply in the first half of
2004, LG.Philips LCD contributed KRW 836
billion through equity method accounting. We
also incurred an equity method loss of KRW 128
billion from LG.Philips Displays in 2004 mainly
due to losses from asset impairment. However,
this loss was much lower than the equity
method loss incurred by LG.Philips Displays in
2003.
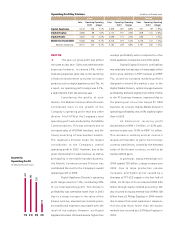
Operating Profit by Division (in billions of Korean won)
2004 2003 Change
Sales Operating Operating Sales Operating Operating Sales Operating Operating
Profit Margin Profit Margin Profit Margin
Digital Appliance 6,216 448 7.2% 5,649 497 8.8% 567 -49 -1.6%p
Digital Display 4,983 89 1.8% 4,174 191 4.6% 809 -102 -2.8%p
Digital Media 3,803 174 4.6% 4,069 173 4.3% -266 1 0.3%p
Mobile Communications 9,484 636 6.7% 6,106 319 5.2% 3,378 317 1.5%p
Mobile Handsets 8,351 530 6.3% 5,184 249 4.8% 3,167 280 1.5%p
1Q 2Q 3Q 4Q
Quarterly
Operating Profit
(in billions of Korean won)
407
95
393
355