LG 2004 Annual Report Download - page 66
Download and view the complete annual report
Please find page 66 of the 2004 LG annual report below. You can navigate through the pages in the report by either clicking on the pages listed below, or by using the keyword search tool below to find specific information within the annual report.-
 1
1 -
2
-
3
-
4
-
5
-
6
-
7
-
8
-
9
-
10
-
11
-
12
-
13
-
14
-
15
-
16
-
17
-
18
-
19
-
20
-
21
-
22
-
23
-
24
-
25
-
26
-
27
-
28
-
29
-
30
-
31
-
32
-
33
-
34
-
35
-
36
-
37
-
38
-
39
-
40
-
41
-
42
-
43
-
44
-
45
-
46
-
47
-
48
-
49
-
50
-
51
-
52
-
53
-
54
-
55
-
 56
56 -
 57
57 -
 58
58 -
 59
59 -
 60
60 -
 61
61 -
 62
62 -
 63
63 -
 64
64 -
 65
65 -
 66
66 -
 67
67 -
 68
68 -
 69
69 -
 70
70 -
 71
71 -
 72
72 -
 73
73 -
 74
74 -
 75
75 -
 76
76 -
77
-
78
-
79
-
80
-
81
-
82
-
83
-
84
-
85
-
86
-
87
-
88
-
89
-
90
-
91
-
92
-
93
-
94
-
95
-
96
-
97
-
98
-
99
-
100
-
101
-
102
-
103
-
104
-
105
-
106
-
107
-
108
-
109
-
110
-
111
-
112
-
113
-
114
-
115
-
116
-
117
-
118
-
119
-
120
-
121
-
122
-
123
-
124
-
125
-
126
-
127
-
128
-
129
 |
 |

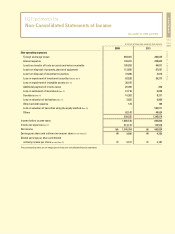
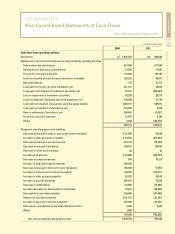
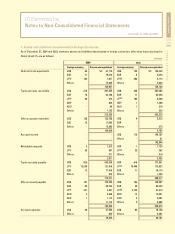
LG Electronics Inc.
Non-Consolidated Statements of Cash Flows
Years ended December 31, 2004 and 2003
Cash flows from investing activities
Disposal of short-term financial instruments
Acquisition of short-term financial instruments
Increase in short-term and long-term loans, net
Decrease in short-term and long-term loans, net
Acquisition of long-term financial instruments
Proceeds from disposal of investment securities
Acquisition of investment securities
Payment of refundable deposits
Proceeds from disposal of property, plant and equipment
Proceeds from disposal of intangible assets
Proceeds from disposal of derivatives
Acquisition of property, plant and equipment
Acquisition of intangible assets
Acquisition of derivatives
Others
Net cash used in investing activities
Cash flows from financing activities
Proceeds from short-term borrowings
Payment of current maturities of long-term debt
Proceeds from issuance of debentures
Proceeds from long-term debt
Payment of short-term borrowings
Payment of debentures
Payment of dividends
Proceeds from disposal of treasury stock
Acquisition of treasury stock
Early redemption of long-term debt
Net cash provided by (used in) financing activities
Net increase in cash and cash equivalents
Cash and cash equivalents (Note 31)
Beginning of the year
End of the year
2003
-
(39,966)
-
73,214
(894)
175,654
(490,732)
(32,715)
39,630
291
4,603
(758,998)
(82,867)
-
(200)
(1,112,980)
342,024
(705,460)
1,247,738
22,242
-
(24,347)
(157,396)
2,536
-
(243)
727,094
519,677
17,176
536,853
(in millions of Korean won)
2004
40,732
-
(26,397)
-
(8,338)
304,471
(864,922)
(53,888)
41,374
1,395
25,923
(1,113,433)
(47,215)
(7,794)
(402)
(1,708,494)
-
(989,580)
906,581
275,120
(179,243)
-
(196,634)
11,318
(46,298)
-
(218,736)
111,563
536,853
648,416
The accompanying notes are an integral part of these non-consolidated financial statements.