LG 2004 Annual Report Download - page 110
Download and view the complete annual report
Please find page 110 of the 2004 LG annual report below. You can navigate through the pages in the report by either clicking on the pages listed below, or by using the keyword search tool below to find specific information within the annual report.-
 1
1 -
2
-
3
-
4
-
5
-
6
-
7
-
8
-
9
-
10
-
11
-
12
-
13
-
14
-
15
-
16
-
17
-
18
-
19
-
20
-
21
-
22
-
23
-
24
-
25
-
26
-
27
-
28
-
29
-
30
-
31
-
32
-
33
-
34
-
35
-
36
-
37
-
38
-
39
-
40
-
41
-
42
-
43
-
44
-
45
-
46
-
47
-
48
-
49
-
50
-
51
-
52
-
53
-
54
-
55
-
56
-
57
-
58
-
59
-
60
-
61
-
62
-
63
-
64
-
65
-
66
-
67
-
68
-
69
-
70
-
71
-
72
-
73
-
74
-
75
-
76
-
77
-
78
-
79
-
80
-
81
-
82
-
83
-
84
-
85
-
86
-
87
-
88
-
89
-
90
-
91
-
92
-
93
-
94
-
95
-
96
-
97
-
98
-
99
-
 100
100 -
 101
101 -
 102
102 -
 103
103 -
 104
104 -
 105
105 -
 106
106 -
 107
107 -
 108
108 -
 109
109 -
 110
110 -
 111
111 -
 112
112 -
 113
113 -
 114
114 -
 115
115 -
 116
116 -
 117
117 -
 118
118 -
 119
119 -
 120
120 -
121
-
122
-
123
-
124
-
125
-
126
-
127
-
128
-
129
 |
 |

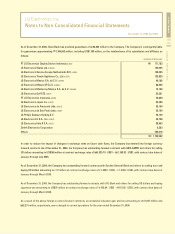
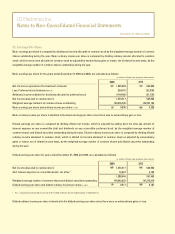
LG Electronics Inc.
Notes to Non-Consolidated Financial Statements
December 31, 2004 and 2003
Sales
External sales
Inter-division sales
Operating income (loss)
Property, plant and equipment
Intangible assets
Depreciation and amortization
(in millions of Korean won)
Telecommunication
Equipment& Handset
7,463,418
33,251
7,496,669
285,711
512,034
366,316
878,350
160,139
Supporting
Division
179,393
125,117
304,510
(117,743)
799,416
408,621
1,208,037
169,418
Digital Display
& Media
6,885,305
107,668
6,992,973
397,482
929,461
47,124
976,585
167,677
Total
20,176,910
281,742
20,458,652
1,062,193
3,122,720
836,301
3,959,021
617,894
Business Division
Digital
Appliance
5,648,794
15,706
5,664,500
496,743
881,809
14,240
896,049
120,660
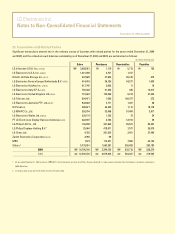
Sales
External sales
Ratio (%)
Inter-division sales
(in millions of Korean won)
Total
24,659,317
100%
347,725
25,007,042
Domestic
5,086,207
20%
347,725
5,433,932
North
America
6,223,292
25%
-
6,223,292
Europe
3,847,650
16%
-
3,847,650
Central
Asia
1,035,247
4%
-
1,035,247
Central &
South
America
663,953
3%
-
663,953
Asia
5,810,769
24%
-
5,810,769
Oceania
683,620
3%
-
683,620
Others
1,308,579
5%
-
1,308,579
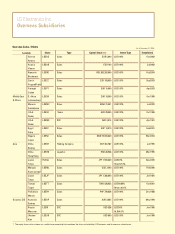
Financial data by business division as of and for the year ended December 31, 2003, were as follows:
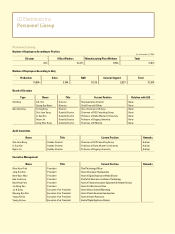
Financial data by geographic area for the year ended December 31, 2004, are as follows:
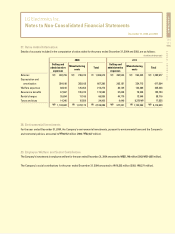
Sales
External sales
Ratio (%)
Inter-division sales
(in millions of Korean won)
Total
20,176,910
100%
281,742
20,458,652
Domestic
4,793,702
24%
281,742
5,075,444
North
America
5,760,389
28%
-
5,760,389
Europe
1,787,823
9%
-
1,787,823
Central
Asia
942,978
5%
-
942,978
Central &
South
America
413,315
2%
-
413,315
Asia
4,894,076
24%
-
4,894,076
Oceania
460,057
2%
-
460,057
Others
1,124,570
6%
-
1,124,570
Financial data by geographic area for the year ended December 31, 2003, were as follows: