LG 2004 Annual Report Download - page 122
Download and view the complete annual report
Please find page 122 of the 2004 LG annual report below. You can navigate through the pages in the report by either clicking on the pages listed below, or by using the keyword search tool below to find specific information within the annual report.-
 1
1 -
2
-
3
-
4
-
5
-
6
-
7
-
8
-
9
-
10
-
11
-
12
-
13
-
14
-
15
-
16
-
17
-
18
-
19
-
20
-
21
-
22
-
23
-
24
-
25
-
26
-
27
-
28
-
29
-
30
-
31
-
32
-
33
-
34
-
35
-
36
-
37
-
38
-
39
-
40
-
41
-
42
-
43
-
44
-
45
-
46
-
47
-
48
-
49
-
50
-
51
-
52
-
53
-
54
-
55
-
56
-
57
-
58
-
59
-
60
-
61
-
62
-
63
-
64
-
65
-
66
-
67
-
68
-
69
-
70
-
71
-
72
-
73
-
74
-
75
-
76
-
77
-
78
-
79
-
80
-
81
-
82
-
83
-
84
-
85
-
86
-
87
-
88
-
89
-
90
-
91
-
92
-
93
-
94
-
95
-
96
-
97
-
98
-
99
-
100
-
101
-
102
-
103
-
104
-
105
-
106
-
107
-
108
-
109
-
110
-
111
-
 112
112 -
 113
113 -
 114
114 -
 115
115 -
 116
116 -
 117
117 -
 118
118 -
 119
119 -
 120
120 -
 121
121 -
 122
122 -
 123
123 -
 124
124 -
 125
125 -
 126
126 -
 127
127 -
 128
128 -
 129
129
 |
 |

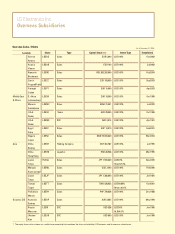
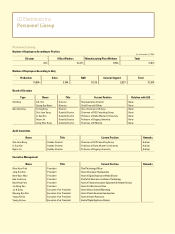
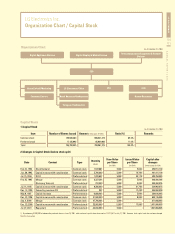
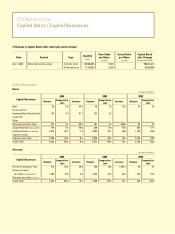
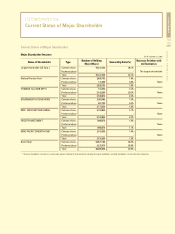
LG Electronics Inc.
Capital Stock / Capital Resources
Capital Resources
Korea
3) Changes in Capital Stock (after stock split and de-merger)
Date Content Type Quantity
(share)
Face Value
per Share
(in KRW)
Issued Value
per Share
(in KRW)
Apr. 1, 2002 Stock split and de-merger Common stock 139,606,263 5,000 - 698,031,315
Preferred stock 17,185,992 5,000 - 85,929,960
Capital Stock
after Changes
(In thousands of KRW)
Capital Resources Balance
2004
Composition
ratio Increase Balance
2003
Composition
ratio
2002
Increase Balance Composition
ratio
Bank 22 0.9 -54.0 48 1.9 12.2 43 2.0
Insurance Firm
Investment Bank / Securities Firm
105 4.5 -21.7 134 5.2
Lease Firm
Other
Financial Institution Total 127 5.4 -30.2 181 7.0 325.6 43 2.0
Corporate bond(private placement) 126 5.4 -58.8 306 11.9 -19.5 380 17.4
Corporate bond(public offering) 2,070 89.1 -1.0 2,090 81.1 18.8 1,760 80.6
Capital increase
Capital market Total 2,196 94.6 -8.3 2,396 93.0 12.0 2,140 98.0
Grand Total 2,323 100.0 -9.9 2,577 100.0 18.1 2,183 100.0
Overseas
Capital Resources Balance
2004
Composition
ratio Increase Balance
2003
Composition
ratio
2002
Increase Balance Composition
ratio
Financial Institutions Total 370 25.4 56.6 236 18.8 1,087.4 20 2.7
Foreign currency
securities (Corporate bond) 1,087 74.6 6.3 1,023 81.2 42.0 720 97.3
Overseas securities (stock, etc.)
Grand Total 1,457 100.0 15.7 1,259 100.0 70.1 740 100.0
(In billions of KRW, %)
(In billions of KRW, %)