LG 2004 Annual Report Download - page 65
Download and view the complete annual report
Please find page 65 of the 2004 LG annual report below. You can navigate through the pages in the report by either clicking on the pages listed below, or by using the keyword search tool below to find specific information within the annual report.-
 1
1 -
2
-
3
-
4
-
5
-
6
-
7
-
8
-
9
-
10
-
11
-
12
-
13
-
14
-
15
-
16
-
17
-
18
-
19
-
20
-
21
-
22
-
23
-
24
-
25
-
26
-
27
-
28
-
29
-
30
-
31
-
32
-
33
-
34
-
35
-
36
-
37
-
38
-
39
-
40
-
41
-
42
-
43
-
44
-
45
-
46
-
47
-
48
-
49
-
50
-
51
-
52
-
53
-
54
-
 55
55 -
 56
56 -
 57
57 -
 58
58 -
 59
59 -
 60
60 -
 61
61 -
 62
62 -
 63
63 -
 64
64 -
 65
65 -
 66
66 -
 67
67 -
 68
68 -
 69
69 -
 70
70 -
 71
71 -
 72
72 -
 73
73 -
 74
74 -
 75
75 -
76
-
77
-
78
-
79
-
80
-
81
-
82
-
83
-
84
-
85
-
86
-
87
-
88
-
89
-
90
-
91
-
92
-
93
-
94
-
95
-
96
-
97
-
98
-
99
-
100
-
101
-
102
-
103
-
104
-
105
-
106
-
107
-
108
-
109
-
110
-
111
-
112
-
113
-
114
-
115
-
116
-
117
-
118
-
119
-
120
-
121
-
122
-
123
-
124
-
125
-
126
-
127
-
128
-
129
 |
 |

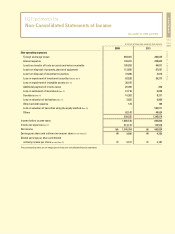
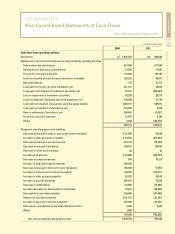
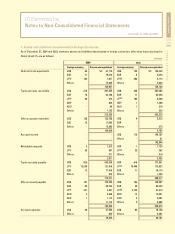
LG Electronics Inc.
Non-Consolidated Statements of Cash Flows
Years ended December 31, 2004 and 2003
LG ELECTRONICS ANNUAL REPORT 2004
064
065
Cash flows from operating activities
Net income
Adjustments to reconcile net income to net cash provided by operating activities
Depreciation and amortization
Amortization of discounts on debentures
Provision for severance benefits
Loss from transfer of trade accounts and notes receivable
Bad debt expense
Loss (gain) on foreign currency translation, net
Loss (gain) from disposal of investment securities, net
Loss on impairment of investment securities
Loss from disposal of property, plant and equipment, net
Loss (gain) on valuation of securities using the equity method
Loss (gain) on valuation of derivatives, net
Gain on settlement of derivatives, net
Provision for product warranty
Others
Changes in operating assets and liabilities
Decrease (increase) in trade accounts and notes receivable
Increase in other accounts receivable
Decrease (increase) in accrued income
Decrease (increase) in advances
Decrease in other current assets
Increase in inventories
Decrease in prepaid expenses
Increase in long-term prepaid expenses
Decrease (increase) in deferred income tax assets
Increase in trade accounts and notes payable
Increase in other accounts payable
Increase in accrued expenses
Decrease in withholdings
Increase (decrease) in advances from customers
Decrease in income taxes payable
Payment of severance benefits
Increase in severance insurance deposits
Decrease in contributions to the National Pension Fund
Others
Net cash provided by operating activities
2003
662,824
617,894
17,981
135,750
96,871
31,273
25,640
(500,920)
29,273
61,750
584,571
9,206
(3,027)
4,782
(104,473)
1,006,571
59,626
(213,827)
(30,508)
139,003
21
(308,259)
10,277
-
(7,354)
(170,511)
39,633
27,209
(14,385)
(80,938)
(107,848)
(81,297)
(27,341)
2,667
-
(763,832)
905,563
(in millions of Korean won)
2004
1,545,954
667,366
31,399
173,582
120,252
124
(81,117)
25,331
62,228
106,268
(764,917)
(51,093)
(25,651)
61,675
3,464
328,911
(116,794)
(110,657)
163,774
(18,677)
20
(170,868)
843
(56,033)
185,962
(19,581)
20,225
385,027
(11,865)
83,661
(39,642)
(109,117)
(27,024)
3,066
1,608
163,928
2,038,793