Kia 2006 Annual Report Download - page 93
Download and view the complete annual report
Please find page 93 of the 2006 Kia annual report below. You can navigate through the pages in the report by either clicking on the pages listed below, or by using the keyword search tool below to find specific information within the annual report.-
 1
1 -
2
-
3
-
4
-
5
-
6
-
7
-
8
-
9
-
10
-
11
-
12
-
13
-
14
-
15
-
16
-
17
-
18
-
19
-
20
-
21
-
22
-
23
-
24
-
25
-
26
-
27
-
28
-
29
-
30
-
31
-
32
-
33
-
34
-
35
-
36
-
37
-
38
-
39
-
40
-
41
-
42
-
43
-
44
-
45
-
46
-
47
-
48
-
49
-
50
-
51
-
52
-
53
-
54
-
55
-
56
-
57
-
58
-
59
-
60
-
61
-
62
-
63
-
64
-
65
-
66
-
67
-
68
-
69
-
70
-
71
-
72
-
73
-
74
-
75
-
76
-
77
-
78
-
79
-
80
-
81
-
82
-
 83
83 -
 84
84 -
 85
85 -
 86
86 -
 87
87 -
 88
88 -
 89
89 -
 90
90 -
 91
91 -
 92
92 -
 93
93 -
 94
94 -
 95
95 -
 96
96 -
 97
97 -
 98
98 -
 99
99 -
 100
100 -
 101
101 -
 102
102
 |
 |

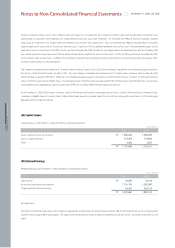
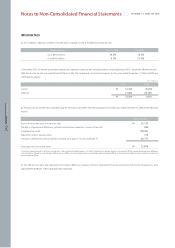
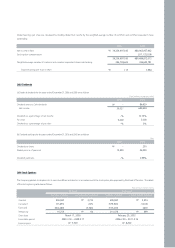
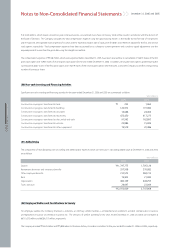
Diluted earnings per share are calculated by dividing diluted net income by the weighted-average number of common and common equivalent shares
outstanding.
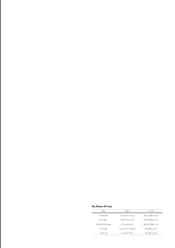
(28) Dividends
(a) Details of dividends for the years ended December 31, 2006 and 2005 are as follows:
(b) Dividend yield ratio for the years ended December 31, 2006 and 2005 are as follows:
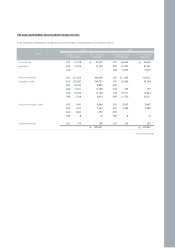
(29) Stock Options
The Company granted stock options to its executive officers and directors in accordance with the stock option plan approved by the Board of Directors. The details
of the stock options granted are as follows:
39,336,697,185
-
39,336,697,185
346,709,625
113
₩
₩
2006 2005
680,903,937,602
(217,125,529)
680,686,812,073
346,622,781
1,964
Net income in Won
Stock option compensation
Weighted-average number of common and common equivalent shares outstanding
Diluted earnings per share in Won
-
39,337
-%
5,000
-%
2006 2005
86,629
680,904
12.72%
5,000
5%
Dividend amount: Cash dividends
Net income
Dividends as a percentage of net income
Par value
Dividends as a percentage of par value
Won (millions except par value)
₩
-
13,450
-%
2006 2005
250
26,000
0.96%
Dividend per share
Market price as of year end
Dividend yield ratio
Won
₩
950,000
(31,655)
(902,089)
16,256
3,735
(125)
(3,546)
64
₩
₩
₩
₩
Compensation expenses Compensation expensesNumber of shares
695,000
(379,903)
(105,019)
210,078
2,974
(1,614)
(461)
899
Number of shares
1st Grant 2nd Grant
Granted
Cancelled
Exercised
Remaining
Grant date
Exercisable period
Exercise price
Won (million, except shares)
March 17, 2000
2003.3.18 ~ 2008.3.17
₩5,500
February 20, 2003
2006.2.20 ~ 2011.2.19
₩8,200