Kia 2006 Annual Report Download - page 50
Download and view the complete annual report
Please find page 50 of the 2006 Kia annual report below. You can navigate through the pages in the report by either clicking on the pages listed below, or by using the keyword search tool below to find specific information within the annual report.-
 1
1 -
2
-
3
-
4
-
5
-
6
-
7
-
8
-
9
-
10
-
11
-
12
-
13
-
14
-
15
-
16
-
17
-
18
-
19
-
20
-
21
-
22
-
23
-
24
-
25
-
26
-
27
-
28
-
29
-
30
-
31
-
32
-
33
-
34
-
35
-
36
-
37
-
38
-
39
-
 40
40 -
 41
41 -
 42
42 -
 43
43 -
 44
44 -
 45
45 -
 46
46 -
 47
47 -
 48
48 -
 49
49 -
 50
50 -
 51
51 -
 52
52 -
 53
53 -
 54
54 -
 55
55 -
 56
56 -
 57
57 -
 58
58 -
 59
59 -
 60
60 -
61
-
62
-
63
-
64
-
65
-
66
-
67
-
68
-
69
-
70
-
71
-
72
-
73
-
74
-
75
-
76
-
77
-
78
-
79
-
80
-
81
-
82
-
83
-
84
-
85
-
86
-
87
-
88
-
89
-
90
-
91
-
92
-
93
-
94
-
95
-
96
-
97
-
98
-
99
-
100
-
101
-
102
 |
 |

050
KIA MOTORS 2006 Annual Report
Non-Operating Income and Expense
2006 net non-operating income totaled ₩199 billion, a drop of ₩417 billion year on year. In 2005, there were several one-off gains on the non-operating side. First,
there was a ₩262 billion gain from a valuation method change related to Hyundai Steel. Second, there was a ₩51 billion related to the sale of investments. Finally,
the company earned other income of ₩64 billion resulting from a law suit termination against a financial institution.
Net interest expense came to ₩25 billion which increased by ₩10 billion year on year due to increase of debt. Foreign exchange gain/loss recorded a net loss of
₩0.8 billion this year (versus a ₩96 billion gain in 2005), since liabilities in the Euro took up a significant part in the company’s total foreign liabilities. While
appreciation of the Korean Won against the Euro led to a gain in 2005, this reversed turned to a loss in 2006.
Net equity gains fell from ₩431 billion in 2005 to ₩278 billion in 2006, but there was a ₩117 billion one-off item in 2005.
Net Income / Income Tax Expense
The strong Won, slack RV demand in Korea market and rising marketing expenses led to an operating loss of ₩125 billion. Recurring profit was ₩73 billion thanks
to net non-operating income of ₩199 billion including an equity gain. Net profit came to ₩39 billion. We were hit by a relatively high income tax this year (₩34
billion, an effective tax rate of 46%) despite our weak performance. This was due to the retroactive application of ₩75 billion in tax expenses: this retroactive
application of tax expenses was required in first quarter since amendments to Korean income tax laws regarding equity gains came into effect. Because Kia has
significant investment tax credits stemming from operating loss and other areas, our income tax rate is estimated to be under 25% compared to the normal income
tax rate of 27.5% (unless we record a significant operating surplus in the next 1~2 years).
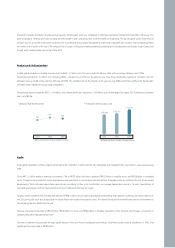
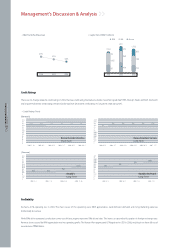
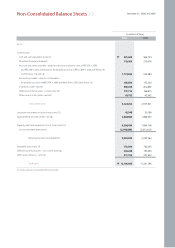
Assets
Current Assets
Cash balances at the end of 2006 including cash & cash equivalents, and short-term financial instruments, came to ₩632 billion, a decline of ₩485 billion versus
2005. Cash & cash equivalents came to ₩522 billion while short-term financial instruments totaled ₩110 billion. The fall in the cash balance can be attributed to an
increase in working capital expenditures resulting from a weaker operating performance, increase in accounts receivable and decrease in accounts payable.
One of the main factors for the increase in accounts receivable was that compared with previous years, there were an unusually high number of holidays at the end
of 2006 when shipment volumes reached their peak. This led to difficulties in cashing accounts receivable through banks, and consequently to an increase in
accounts receivable, while accounts receivable were significantly liquidated by issuing asset backed commercial paper (ABCP) in 2005. Accounts payable, in
contrast, dipped due to a new cash-based payment policy geared to small and medium-sized suppliers.
Fixed Assets
With regard to fixed assets, investments totaled ₩2,982 billion, an increase of ₩652 billion over 2005. Equity securities, using the equity method, rose to ₩2,484
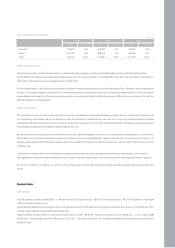
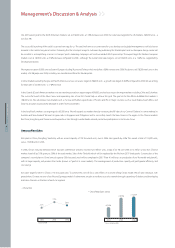
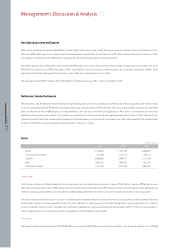
20052006 2004
Assets 12,106,605 11,241,785 10,685,879
Cash & Cash Equivalents 631,608 1,116,724 1,560,517
Liabilities 6,858,849 5,989,417 5,721,456
Debt 2,940,150 2,046,040 1,691,219
Shareholders' Equity 5,247,756 5,252,368 4,964,423
(KRW in millions)
Management’s Discussion & Analysis