Kia 2006 Annual Report Download - page 54
Download and view the complete annual report
Please find page 54 of the 2006 Kia annual report below. You can navigate through the pages in the report by either clicking on the pages listed below, or by using the keyword search tool below to find specific information within the annual report.-
 1
1 -
2
-
3
-
4
-
5
-
6
-
7
-
8
-
9
-
10
-
11
-
12
-
13
-
14
-
15
-
16
-
17
-
18
-
19
-
20
-
21
-
22
-
23
-
24
-
25
-
26
-
27
-
28
-
29
-
30
-
31
-
32
-
33
-
34
-
35
-
36
-
37
-
38
-
39
-
40
-
41
-
42
-
43
-
 44
44 -
 45
45 -
 46
46 -
 47
47 -
 48
48 -
 49
49 -
 50
50 -
 51
51 -
 52
52 -
 53
53 -
 54
54 -
 55
55 -
 56
56 -
 57
57 -
 58
58 -
 59
59 -
 60
60 -
 61
61 -
 62
62 -
 63
63 -
 64
64 -
65
-
66
-
67
-
68
-
69
-
70
-
71
-
72
-
73
-
74
-
75
-
76
-
77
-
78
-
79
-
80
-
81
-
82
-
83
-
84
-
85
-
86
-
87
-
88
-
89
-
90
-
91
-
92
-
93
-
94
-
95
-
96
-
97
-
98
-
99
-
100
-
101
-
102
 |
 |
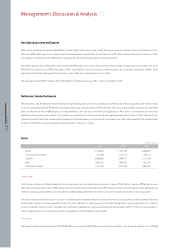
054
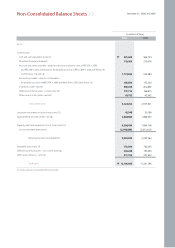
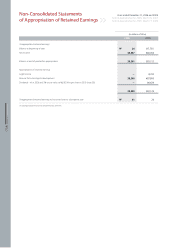
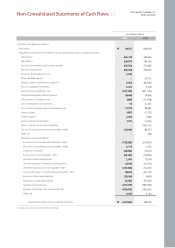
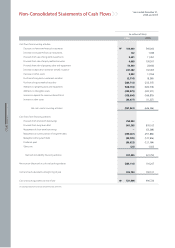
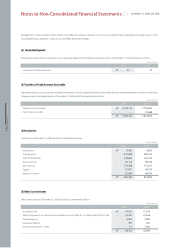
KIA MOTORS 2006 Annual Report
December 31, 2006 and 2005
Non-Consolidated Balance Sheets
(In millions of Won)
2006 2005
Liabilities and Stockholders’ Equity
Current liabilities:
Accounts and notes payable - trade (notes 8 and 16)
Short-term borrowings (notes 14 and 16)
Provision for warranties (note 17)
Accounts and notes payable - other (notes 8 and 16)
Income taxes payable
Current portion of long-term debt (notes 15 and 16)
Other current liabilities (notes 13 and 16)
Total current liabilities
Long-term debt (notes 12, 15 and 16)
Long-term provision for warranties (note 17)
Deposits received
Accrual for retirement and severance benefits (note 18)
Total liabilities
Stockholders’ equity: (note 21)
Common stock of ₩5,000 par value (note 21)
Authorized - 820,000,000 shares
Issued - 347,230,455 shares in 2006 and 2005
Outstanding - 346,628,405 shares in 2006 and 346,516,719 shares in 2005
Capital surplus (notes 21 and 22)
Retained earnings (notes 21 and 23)
Capital adjustments (notes 6, 7, 21, 24 and 29)
Total stockholders’ equity
Commitments and contingencies (note 19)
Total liabilities and stockholders’ equity
1,694,370
659,979
272,741
702,394
-
502,127
271,493
4,103,104
1,778,043
430,748
15,499
531,455
6,858,849
1,848,652
1,703,844
1,832,861
(137,601)
5,247,756
12,106,605
1,968,555
312,691
259,704
604,189
2,244
258,565
73,487
3,479,435
1,474,784
464,448
16,425
554,325
5,989,417
1,848,652
1,703,011
1,880,153
(179,448)
5,252,368
11,241,785
₩
₩
See accompanying notes to non-consolidated financial statements