Kia 2006 Annual Report Download - page 92
Download and view the complete annual report
Please find page 92 of the 2006 Kia annual report below. You can navigate through the pages in the report by either clicking on the pages listed below, or by using the keyword search tool below to find specific information within the annual report.-
 1
1 -
2
-
3
-
4
-
5
-
6
-
7
-
8
-
9
-
10
-
11
-
12
-
13
-
14
-
15
-
16
-
17
-
18
-
19
-
20
-
21
-
22
-
23
-
24
-
25
-
26
-
27
-
28
-
29
-
30
-
31
-
32
-
33
-
34
-
35
-
36
-
37
-
38
-
39
-
40
-
41
-
42
-
43
-
44
-
45
-
46
-
47
-
48
-
49
-
50
-
51
-
52
-
53
-
54
-
55
-
56
-
57
-
58
-
59
-
60
-
61
-
62
-
63
-
64
-
65
-
66
-
67
-
68
-
69
-
70
-
71
-
72
-
73
-
74
-
75
-
76
-
77
-
78
-
79
-
80
-
81
-
 82
82 -
 83
83 -
 84
84 -
 85
85 -
 86
86 -
 87
87 -
 88
88 -
 89
89 -
 90
90 -
 91
91 -
 92
92 -
 93
93 -
 94
94 -
 95
95 -
 96
96 -
 97
97 -
 98
98 -
 99
99 -
 100
100 -
 101
101 -
 102
102
 |
 |

092
KIA MOTORS 2006 Annual Report
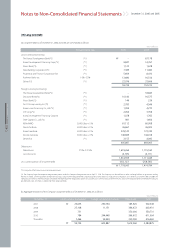
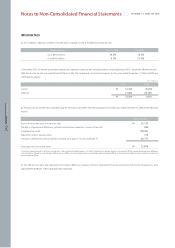
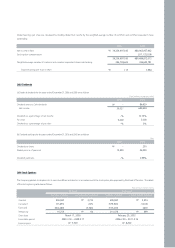
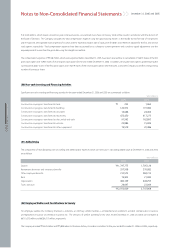
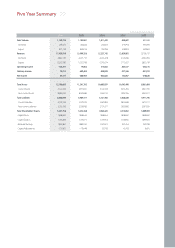
(h) The deferred tax assets and liabilities that were directly charged or credited to capital adjustments as of December 31, 2006 are as follows:
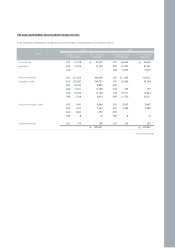
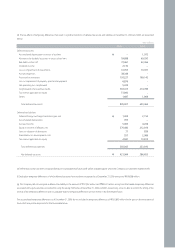
(i) Under SKAS No. 16, the deferred tax amounts should be presented as a net current asset or liability and a net non-current asset or liability. In addition, the
Company is required to disclose aggregate deferred tax assets (liabilities). As of December 31, 2006, details of aggregate deferred tax assets (liabilities) are as follows:
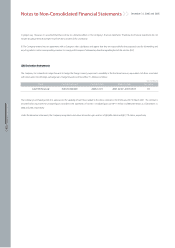
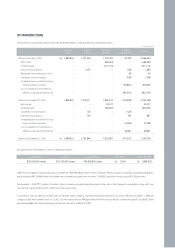
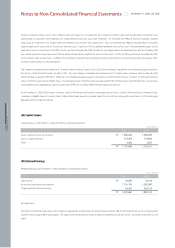
(27) Earnings Per Share
Basic earnings per share are calculated by dividing net income by the weighted-average number of shares of common stock outstanding.
(7,570)
178,799
171,229
₩
₩
Temporary differences Deferred tax assets (liabilities)
(1,950)
49,169
47,219
Unrealized gain on valuation of long-term investment securities
Loss on valuation of investments in affiliates using equity method, net
Won (millions)
217,049
263,495
7,745
343,859
139,440
702,644
25,003
19,312
339,404
211,425
6,131
2,275,507
(3,397)
(5,216)
(18,420)
(1,150,628)
(111)
(2,027)
(29,245)
(1,209,044)
1,066,463
₩
₩
Temporary differences at
December 31, 2006
49,227
-
-
-
-
75,003
-
-
58,551
-
-
182,781
-
-
(5,065)
-
-
-
-
(5,065)
177,716
10,461
72,461
2,130
10,053
38,346
118,224
6,876
5,324
304,864
51,800
1,687
622,226
(935)
(1,434)
-
(370,440)
(31)
(557)
(4,581)
(377,978)
244,248
Non-currentCurrent
Deferred tax assets (liabilities)
Assets:
Allowance for doubtful accounts
Bad debts written off
Dividend income
Loss on impairment of investments
Accrued expenses
Provision for warranties
Loss on impairment of property, plant and equipment
Carryforwards of unused tax credits
Net operating loss carryforward
Tax reserve applicable to equity
Others
Liabilities:
Accumulated depreciation
Deferred foreign exchange translation gain, net
Accrued income
Equity in income of affiliates, net
Gain on valuation of derivatives
Amortization on development costs
Tax reserve applicable to equity
Won (millions)
39,336,697,185
346,522,839
114
₩
₩
2006 2005
680,903,937,602
346,224,844
1,967
Net income in Won
Weighted-average number of common shares outstanding
Earnings per share in Won
December 31, 2006 and 2005
Notes to Non-Consolidated Financial Statements