Kia 2006 Annual Report Download - page 53
Download and view the complete annual report
Please find page 53 of the 2006 Kia annual report below. You can navigate through the pages in the report by either clicking on the pages listed below, or by using the keyword search tool below to find specific information within the annual report.-
 1
1 -
2
-
3
-
4
-
5
-
6
-
7
-
8
-
9
-
10
-
11
-
12
-
13
-
14
-
15
-
16
-
17
-
18
-
19
-
20
-
21
-
22
-
23
-
24
-
25
-
26
-
27
-
28
-
29
-
30
-
31
-
32
-
33
-
34
-
35
-
36
-
37
-
38
-
39
-
40
-
41
-
42
-
 43
43 -
 44
44 -
 45
45 -
 46
46 -
 47
47 -
 48
48 -
 49
49 -
 50
50 -
 51
51 -
 52
52 -
 53
53 -
 54
54 -
 55
55 -
 56
56 -
 57
57 -
 58
58 -
 59
59 -
 60
60 -
 61
61 -
 62
62 -
 63
63 -
64
-
65
-
66
-
67
-
68
-
69
-
70
-
71
-
72
-
73
-
74
-
75
-
76
-
77
-
78
-
79
-
80
-
81
-
82
-
83
-
84
-
85
-
86
-
87
-
88
-
89
-
90
-
91
-
92
-
93
-
94
-
95
-
96
-
97
-
98
-
99
-
100
-
101
-
102
 |
 |

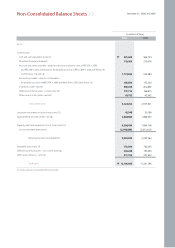
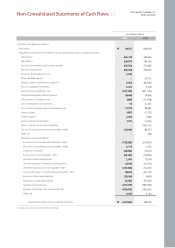
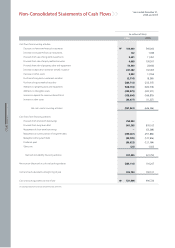
December 31, 2006 and 2005
Non-Consolidated Balance Sheets
(In millions of Won)
2006 2005
Assets
Current assets:
Cash and cash equivalents (note 16)
Short-term financial instruments
Accounts and notes receivable - trade, less discount on present value of ₩2,329 in 2006
and ₩2,338 in 2005 and allowance for doubtful accounts of ₩127,849 in 2006 and ₩163,519
in 2005 (notes 3, 8 and 16)
Accounts receivable - other, less of allowance
for doubtful accounts of ₩83,754 in 2006 and ₩69,594 in 2005 (notes 8 and 16)
Inventories (notes 4 and 9)
Deferred income tax assets - current (note 26)
Other current assets (notes 5 and 20)
Total current assets
Long-term investment securities (notes 6 and 12)
Equity method securities (notes 7 and 8)
Property, plant and equipment, at cost (notes 9 and 12)
Less accumulated depreciation
Net property, plant and equipment
Intangible assets (note 10)
Deferred income tax assets - non-current (note 26)
Other assets (notes 2, 11 and 16)
Total assets
521,608
110,000
1,173,926
185,854
903,395
177,716
49,753
3,122,252
42,548
2,483,683
8,206,494
(2,976,896)
5,229,598
772,550
244,248
211,726
12,106,605
906,724
210,000
533,484
155,224
870,892
196,615
42,962
2,915,901
50,186
1,868,397
7,846,196
(2,613,633)
5,232,563
763,045
190,040
221,653
11,241,785
₩
₩
See accompanying notes to non-consolidated financial statements.