Kia 2006 Annual Report Download - page 51
Download and view the complete annual report
Please find page 51 of the 2006 Kia annual report below. You can navigate through the pages in the report by either clicking on the pages listed below, or by using the keyword search tool below to find specific information within the annual report.-
 1
1 -
2
-
3
-
4
-
5
-
6
-
7
-
8
-
9
-
10
-
11
-
12
-
13
-
14
-
15
-
16
-
17
-
18
-
19
-
20
-
21
-
22
-
23
-
24
-
25
-
26
-
27
-
28
-
29
-
30
-
31
-
32
-
33
-
34
-
35
-
36
-
37
-
38
-
39
-
40
-
 41
41 -
 42
42 -
 43
43 -
 44
44 -
 45
45 -
 46
46 -
 47
47 -
 48
48 -
 49
49 -
 50
50 -
 51
51 -
 52
52 -
 53
53 -
 54
54 -
 55
55 -
 56
56 -
 57
57 -
 58
58 -
 59
59 -
 60
60 -
 61
61 -
62
-
63
-
64
-
65
-
66
-
67
-
68
-
69
-
70
-
71
-
72
-
73
-
74
-
75
-
76
-
77
-
78
-
79
-
80
-
81
-
82
-
83
-
84
-
85
-
86
-
87
-
88
-
89
-
90
-
91
-
92
-
93
-
94
-
95
-
96
-
97
-
98
-
99
-
100
-
101
-
102
 |
 |
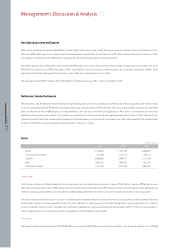
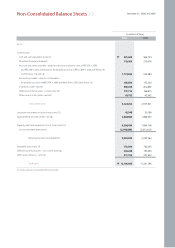
billion, up ₩615 billion from the previous year. Capital increases were the result of our affiliated companies (Slovakia plant: ₩216 billion, China plant: ₩77 billion)
and gains were the result of higher share values in equities we own (e.g.: Hyundai Mobis, Hyundai Steel).
Tangible assets for 2006 totaled ₩5,230 billion, similar to the 2005 level: Investment and depreciation figures were similar. For the same reason, intangible assets
remained at ₩773 billion, similar to the 2005 figure.
Liabilities
Company debt totaled ₩2,940 billion, up ₩894 billion from the previous year. Debt has been increasing due to a weaker-than-expected operating performance
and continuous capital expenditures in R&D and overseas facilities. However we are confident that the conditions will notably improve once profitability perks up
and our overseas investments are completed. We will focus on improving profitability and maintaining a stable credit-line to ensure liquidity.
Current Liabilities
Accounts payable fell to ₩1,694 billion, down by ₩274 billion from 2005. This is due a change in trade terms for our small and medium-sized suppliers. Short-term
borrowings were ₩660 billion, a rise of ₩347 billion related to the financing of working capital. The current portion of long-term borrowings rose to ₩316 billion,
up ₩250 billion from the previous year while fixed long-term borrowings declined by ₩206 billion from the previous year to ₩349 billion.
Long-term Liabilities
Total debentures totaled ₩1,429 billion (excluding current portions), a rise of ₩510 billion over the previous year. In 2006 we issued ₩700 billion in corporate
debentures for repayment and capital expenditures.
Despite the increase of units in operation (UIO) to keep up with increased sale volumes, short and long-term warranty provisions declined by ₩21 billion. This
largely reflects a fall in foreign currency reserves triggered by KRW appreciation, as these reserves constitute 80% of our total warranty provisions. Also the quality
level of our products is improving continuously.
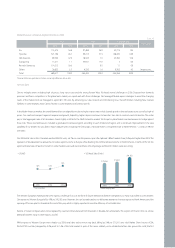
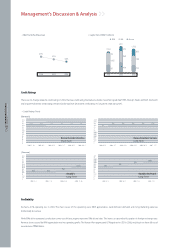
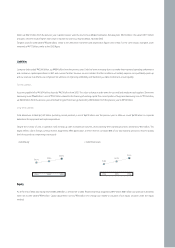
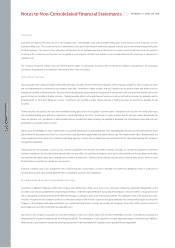
•Debt/Equity
Equity
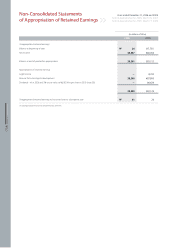
As of the end of 2006, total equity reached ₩5,248 billion, a similar level to 2005. Retained earnings dropped by ₩47 billion. ₩87 billion was paid out in dividends
while net income totaled ₩39 billion. Capital adjustments rose by ₩42 billion: this change was related to valuation of our equity securities under the equity
method.
39.0%
34.1%
56.0%
2004 2005 2006
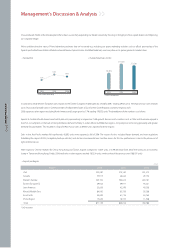
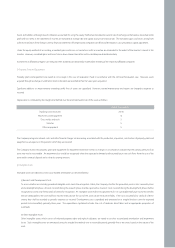
18.2%
15.8%
24.3%
2004 2005 2006
•Debt/Total Assets