Kia 2006 Annual Report Download - page 89
Download and view the complete annual report
Please find page 89 of the 2006 Kia annual report below. You can navigate through the pages in the report by either clicking on the pages listed below, or by using the keyword search tool below to find specific information within the annual report.-
 1
1 -
2
-
3
-
4
-
5
-
6
-
7
-
8
-
9
-
10
-
11
-
12
-
13
-
14
-
15
-
16
-
17
-
18
-
19
-
20
-
21
-
22
-
23
-
24
-
25
-
26
-
27
-
28
-
29
-
30
-
31
-
32
-
33
-
34
-
35
-
36
-
37
-
38
-
39
-
40
-
41
-
42
-
43
-
44
-
45
-
46
-
47
-
48
-
49
-
50
-
51
-
52
-
53
-
54
-
55
-
56
-
57
-
58
-
59
-
60
-
61
-
62
-
63
-
64
-
65
-
66
-
67
-
68
-
69
-
70
-
71
-
72
-
73
-
74
-
75
-
76
-
77
-
78
-
 79
79 -
 80
80 -
 81
81 -
 82
82 -
 83
83 -
 84
84 -
 85
85 -
 86
86 -
 87
87 -
 88
88 -
 89
89 -
 90
90 -
 91
91 -
 92
92 -
 93
93 -
 94
94 -
 95
95 -
 96
96 -
 97
97 -
 98
98 -
 99
99 -
100
-
101
-
102
 |
 |

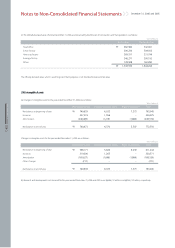
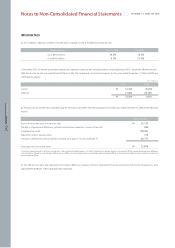
(b) Reserve for technology development
The Company’s appropriated retained earnings for technology development is a voluntary reserve which may be used for purposes other than that for which it was
established, under a resolution of a general shareholders’ meeting.
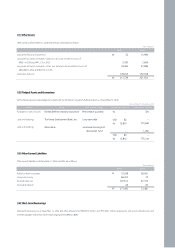
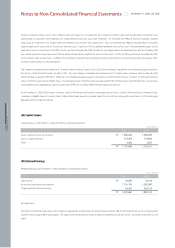
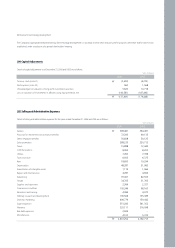
(24) Capital Adjustments
Details of capital adjustments as of December 31, 2006 and 2005 are as follows:
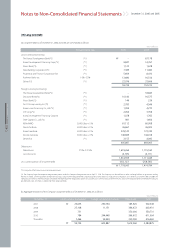
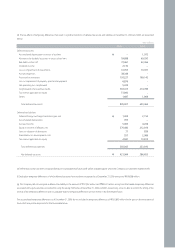
(25) Selling and Administrative Expenses
Details of selling and administrative expenses for the years ended December 31, 2006 and 2005 are as follows:
(3,603)
963
5,620
(140,581)
(137,601)
₩
₩
2006 2005
(4,272)
1,568
10,718
(187,462)
(179,448)
Treasury stock (note 21)
Stock options (note 29)
Unrealized gain on valuation of long-term investment securities
Loss on valuation of investments in affiliates using equity method, net
Won (millions)
389,481
72,393
50,838
288,235
15,888
8,002
7,450
6,933
18,693
48,387
1,119
4,787
97,367
34,705
2,369
105,346
4,084
190,568
406,776
551,283
325,111
2,924
4,513
2,637,252
₩
₩
2006 2005
364,491
69,135
50,125
220,712
12,442
8,203
7,398
6,375
19,294
51,982
1,066
4,656
82,505
31,763
2,327
98,163
4,073
135,389
159,442
541,352
316,098
-
5,722
2,192,713
Salaries
Provision for retirement and severance benefits
Other employee benefits
Sales promotion
Travel
Communications
Utilities
Taxes and dues
Rent
Depreciation
Amortization of intangible assets
Repairs and maintenance
Advertising
Freight
Supplies and stationery
Commissions and fees
Education and training
Ordinary research and development
Overseas marketing
Export expenses
Warranty
Bad debt expenses
Miscellaneous
Won (millions)