Kia 2006 Annual Report Download - page 49
Download and view the complete annual report
Please find page 49 of the 2006 Kia annual report below. You can navigate through the pages in the report by either clicking on the pages listed below, or by using the keyword search tool below to find specific information within the annual report.-
 1
1 -
2
-
3
-
4
-
5
-
6
-
7
-
8
-
9
-
10
-
11
-
12
-
13
-
14
-
15
-
16
-
17
-
18
-
19
-
20
-
21
-
22
-
23
-
24
-
25
-
26
-
27
-
28
-
29
-
30
-
31
-
32
-
33
-
34
-
35
-
36
-
37
-
38
-
 39
39 -
 40
40 -
 41
41 -
 42
42 -
 43
43 -
 44
44 -
 45
45 -
 46
46 -
 47
47 -
 48
48 -
 49
49 -
 50
50 -
 51
51 -
 52
52 -
 53
53 -
 54
54 -
 55
55 -
 56
56 -
 57
57 -
 58
58 -
 59
59 -
60
-
61
-
62
-
63
-
64
-
65
-
66
-
67
-
68
-
69
-
70
-
71
-
72
-
73
-
74
-
75
-
76
-
77
-
78
-
79
-
80
-
81
-
82
-
83
-
84
-
85
-
86
-
87
-
88
-
89
-
90
-
91
-
92
-
93
-
94
-
95
-
96
-
97
-
98
-
99
-
100
-
101
-
102
 |
 |
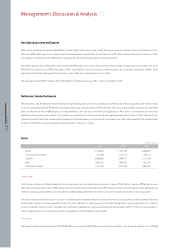
Operating profits were further hurt by flagging domestic industrial demand. In particular, demand for RVs in which historically our sales were strong fell off due to
hikes in diesel oil prices and taxes. Also the company’s marketing expense increased a lot domestically & overseas because of the ongoing fierce competition and
higher level of old stock during the period of model replacement. The marketing expense-to-revenue ratio was 4.0%: a rise of 1.6% point year on year.
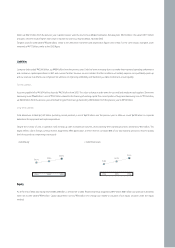
Kia is making concerted efforts to trim costs by working closely with all of our suppliers, including our sister company, to alleviate production costs. In the long term
we aim to cut production costs through engineering changes in car design. On top of this, we’ll reduce fixed expenses burdens by improving utilization rates, and
will increase our average selling price through a better product mix.
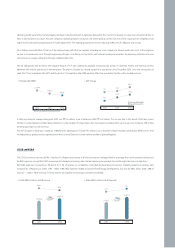
We will additionally seek to reduce the negative impacts of F/X rate volatility by gradually increasing sales portion in domestic market and meeting overseas
demands with vehicles produced in overseas plants. The plant in Slovakia has already started mass production since December 2006. Once the construction of
plant #2 in China (completion late 2007) and the plant in US (completion late 2009) are done, 40% of our production facilities will be located overseas.
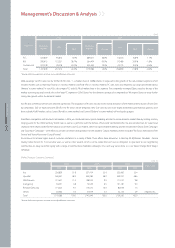
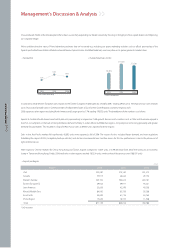
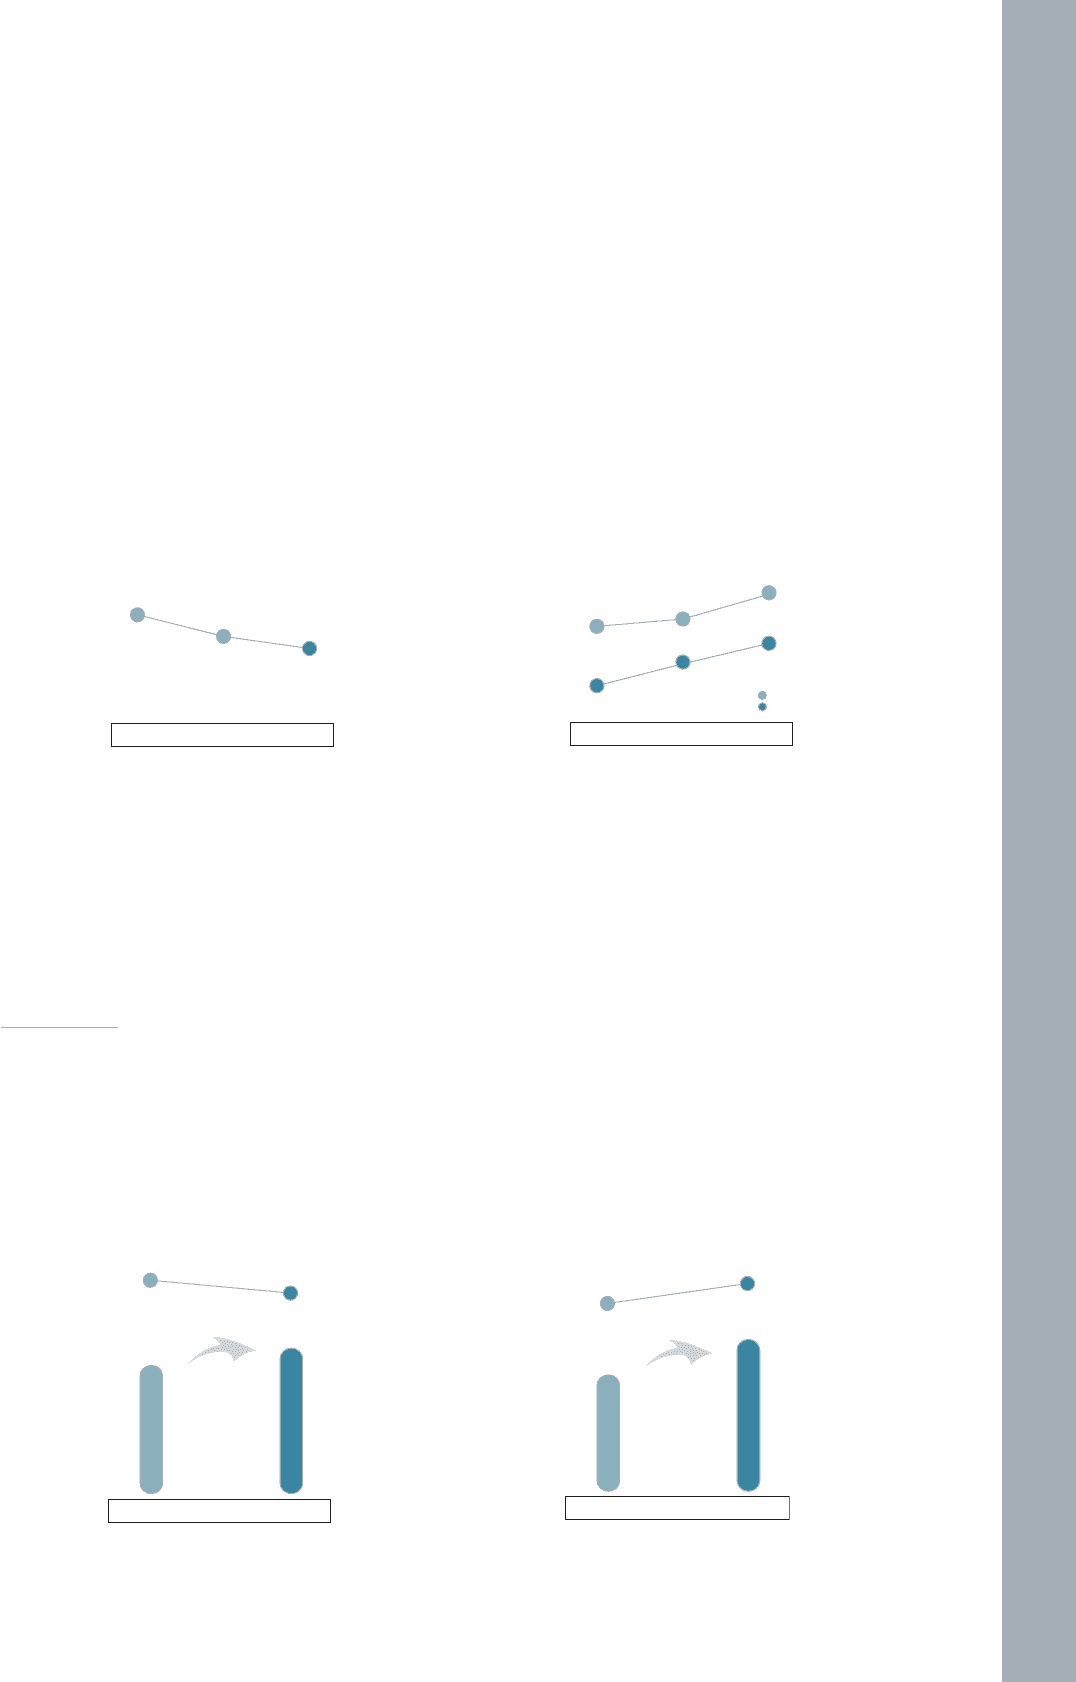
•F/X Rate (USD/KRW)
In 2006, our domestic average selling price (ASP) was ₩16.5 million, a rise of 6.6% over 2005 (₩15.5 million). This rise was due to the launch of the New Carens
(‘Rondo’ in some markets) and New Opirus (‘Amanti’ in some markets). The New Opirus, the most expensive model within our line-up, now comprises 34% of total
domestic passenger car sales revenue.
The ASP of exports in 2006 was $13,600, up 10.8% from the 2005 figure of $12,300. This reflects a rise in the price of export models including face-lifted Sorento. And
we improved our product mix by exporting more New Carnival (‘Sedona’ in some markets) and New Optima/Magentis.
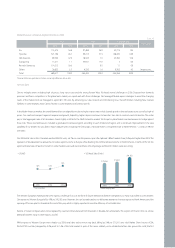
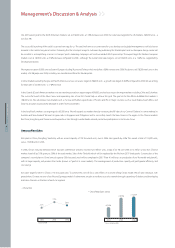
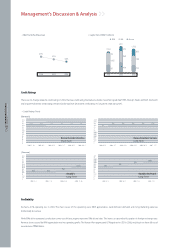
COGS and SG&A
The COGS-to-revenue ratio was 85.6% - a decline of 0.2% point year on year. In the face of revenue shrinkage linked to a stronger Won and increased overhead cost
like R&D expenses, we kept the COGS-to-revenue ratio steady by increasing sales volume, improving our product mix, and through intensive cost reductions.
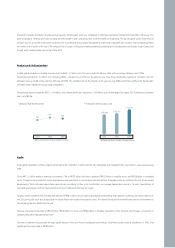
But SG&A expenses increased by 1.4% point, to 15.1% of revenue. As competition intensified domestically and overseas, marketing expense-to-revenue ratio
increased by 1.6% point yoy (2005: 2.4% 2006: 4.0%). R&D expenses related to advanced technology developments also rose by ₩55 billion (2005: 0.8% of
revenue 2006: 1.1% of revenue). For these reasons the SG&A-to-revenue ratio increased considerably.
•COGS (KRW in billions, % of Revenue)
* Based on the company's transaction F/X rate
1,022.5
1,134.9
952.9
2004 2005 2006
15.5
15.1
16.5
12.3
11.2
13.6
2004 2005 2006
Domestic (Million KRW)
Export (Thousand US$)
85.8
85.6
2005 2006
13,732.6
14,927.9
1,195.3
+8.7%
13.7
15.1
2005 2006
2,192.7
2,637.3
444.6
+20.3%
•ASP Change
•SG&A (KRW in billions, % of Revenue)