Kia 2006 Annual Report Download - page 41
Download and view the complete annual report
Please find page 41 of the 2006 Kia annual report below. You can navigate through the pages in the report by either clicking on the pages listed below, or by using the keyword search tool below to find specific information within the annual report.-
 1
1 -
2
-
3
-
4
-
5
-
6
-
7
-
8
-
9
-
10
-
11
-
12
-
13
-
14
-
15
-
16
-
17
-
18
-
19
-
20
-
21
-
22
-
23
-
24
-
25
-
26
-
27
-
28
-
29
-
30
-
 31
31 -
 32
32 -
 33
33 -
 34
34 -
 35
35 -
 36
36 -
 37
37 -
 38
38 -
 39
39 -
 40
40 -
 41
41 -
 42
42 -
 43
43 -
 44
44 -
 45
45 -
 46
46 -
 47
47 -
 48
48 -
 49
49 -
 50
50 -
 51
51 -
52
-
53
-
54
-
55
-
56
-
57
-
58
-
59
-
60
-
61
-
62
-
63
-
64
-
65
-
66
-
67
-
68
-
69
-
70
-
71
-
72
-
73
-
74
-
75
-
76
-
77
-
78
-
79
-
80
-
81
-
82
-
83
-
84
-
85
-
86
-
87
-
88
-
89
-
90
-
91
-
92
-
93
-
94
-
95
-
96
-
97
-
98
-
99
-
100
-
101
-
102
 |
 |

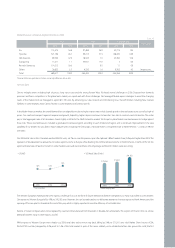
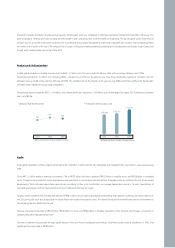
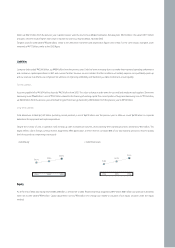
Kia’s Domestic & Export Composition
Demand Fluctuation Factors
The automotive industry is highly interdependent on a complex web of parts suppliers; car makers are therefore highly sensitive to flux from other industries.
Automobiles are the highest priced product of all durable goods. Even the most economical cars exceed 8 million Won. Mid-sized automobiles sell for about 21
million Won, while larger luxury cars on average cost over 30 million Won.
This has a large impact on sales elasticity; during economic slowdowns, many households choose to put off the purchase of a car. Moreover, servicing expectations
are high - our customers expect to receive the kind of service that they believe corresponds to the amount of money they paid for their cars. This in turn requires
precise planning with regards to A/S maintenance and warranties; car makers must therefore offer a diverse range of after sales service solutions that meet the
demands of various customer segments.
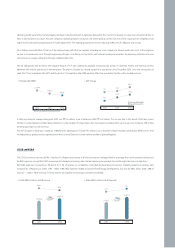
New Business Prospects
Kia is planning to venture into new business lines that will raise the competitiveness and synergies between our various divisions, with the aim of cutting overall
costs and adding more lifetime value to the purchase of every car. We intend to expand business into areas such as recycling, telecommunications, and auto
memberships. We believe that by doing so we can raise the technological innovation of our cars while minimizing the lifetime maintenance costs associated with
the initial purchase, operation & maintenance, and final disposal of our cars.
By moving first into the recycling business, we believe Kia can not only improve the margins on our cars by incorporating more recycled parts, we also believe we
will be able to use our hi-tech manufacturing expertise to produce more environmentally-friendly materials. Moreover, the recycling business will allows us to
develop a wider variety of automobile related products and services available to the public, through more diverse sales channels, which in turn will raise customer
satisfaction level.
In the future our company plans to actively develop and provide various products and services through telecommunications sales channels to our customers.
With regard to the automobile related membership business, we plan to develop various products and services required for ‘Ownership & Maintenance’ purposes.
This business would focus on offering our customers with a diverse range of automobile related merchandise that they need after the purchase of their new
vehicle.
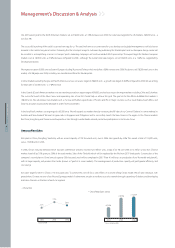
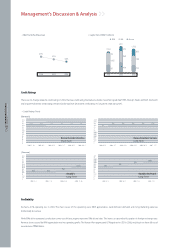
Business Status
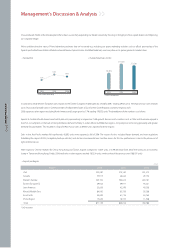
Domestic Sales
Kia’s 2006 domestic car sales reached 269,575, a 1.4% increase over 2005. Exports rose by 3.7% to 871,159, bringing sales to 1,140,734. This represents a respectable
3.2% increase over the previous year.
Overall domestic demand remained sluggish due to continued appreciation of the Korean Won, low consumer confidence level, and a rise in imported cars. These
conditions made it difficult to substantially raise domestic sales.
Industrial demand for each segment in 2006 can be broken down as follows: -9% for RVs compared to the previous year (26,008 units ), an increase of 8.8%
(55,758 units ) for passenger cars, and a 0.9% increase (1,987 units ) for commercial vehicles. The overall growing demand for passenger cars more than offset
the fall in RV sales.
Sales Proportion Sales Proportion Sales Proportion
20042006 2005
Domestic 269,575 23.6 265,825 24.0 250,643 24.8
Export 871,159 76.4 840,016 76.0 760,786 75.2
Total 1,140,734 100.0 1,105,841 100.0 1,011,429 100.0
(Unit, %)