Kia 2006 Annual Report Download - page 55
Download and view the complete annual report
Please find page 55 of the 2006 Kia annual report below. You can navigate through the pages in the report by either clicking on the pages listed below, or by using the keyword search tool below to find specific information within the annual report.-
 1
1 -
2
-
3
-
4
-
5
-
6
-
7
-
8
-
9
-
10
-
11
-
12
-
13
-
14
-
15
-
16
-
17
-
18
-
19
-
20
-
21
-
22
-
23
-
24
-
25
-
26
-
27
-
28
-
29
-
30
-
31
-
32
-
33
-
34
-
35
-
36
-
37
-
38
-
39
-
40
-
41
-
42
-
43
-
44
-
 45
45 -
 46
46 -
 47
47 -
 48
48 -
 49
49 -
 50
50 -
 51
51 -
 52
52 -
 53
53 -
 54
54 -
 55
55 -
 56
56 -
 57
57 -
 58
58 -
 59
59 -
 60
60 -
 61
61 -
 62
62 -
 63
63 -
 64
64 -
 65
65 -
66
-
67
-
68
-
69
-
70
-
71
-
72
-
73
-
74
-
75
-
76
-
77
-
78
-
79
-
80
-
81
-
82
-
83
-
84
-
85
-
86
-
87
-
88
-
89
-
90
-
91
-
92
-
93
-
94
-
95
-
96
-
97
-
98
-
99
-
100
-
101
-
102
 |
 |

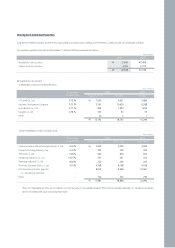
Years ended December 31, 2006 and 2005
Non-Consolidated Statements of Income
(In millions of Won,
except earnings per share)
2006 2005
Sales (notes 8 and 33)
Cost of sales (note 8)
Gross profit
Selling and administrative expenses (note 25)
Operating income (loss)
Other income (expense):
Interest income
Interest expense
Foreign currency translation gain (loss), net
Foreign currency transaction gain, net
Loss on scrapping of inventories
Dividend income
Equity in income of affiliates, net (note 7)
Loss on sale of accounts and notes receivable - trade
Gain on valuation of investment securities
Other bad debt expenses
Loss on impairment of investments
Gain on sale of investments, net
Gain on valuation of derivatives (note 20)
Loss on transaction of derivatives, net (note 20)
Loss on sale of property, plant and equipment, net
Other, net
Income before income taxes
Income taxes (note 26)
Net income
Basic earnings per share of common stock in Won (note 27)
Diluted earnings per share of common stock in Won (note 27)
17,439,910
14,927,949
2,511,961
2,637,252
(125,291)
127,981
(152,641)
(6,428)
7,931
(1,767)
536
277,755
(124,096)
-
-
(57)
345
111
(2,484)
(21,278)
92,596
73,213
33,876
39,337
114
113
15,999,356
13,732,641
2,266,715
2,192,713
74,002
97,373
(112,349)
88,307
4,628
(5,008)
245
431,140
(86,173)
145,155
(20,112)
(27,421)
71,638
3,050
—
(89,967)
114,897
689,405
8,501
680,904
1,967
1,964
₩
₩
See accompanying notes to non-consolidated financial statements.