Kia 2006 Annual Report Download - page 40
Download and view the complete annual report
Please find page 40 of the 2006 Kia annual report below. You can navigate through the pages in the report by either clicking on the pages listed below, or by using the keyword search tool below to find specific information within the annual report.-
 1
1 -
2
-
3
-
4
-
5
-
6
-
7
-
8
-
9
-
10
-
11
-
12
-
13
-
14
-
15
-
16
-
17
-
18
-
19
-
20
-
21
-
22
-
23
-
24
-
25
-
26
-
27
-
28
-
29
-
 30
30 -
 31
31 -
 32
32 -
 33
33 -
 34
34 -
 35
35 -
 36
36 -
 37
37 -
 38
38 -
 39
39 -
 40
40 -
 41
41 -
 42
42 -
 43
43 -
 44
44 -
 45
45 -
 46
46 -
 47
47 -
 48
48 -
 49
49 -
 50
50 -
51
-
52
-
53
-
54
-
55
-
56
-
57
-
58
-
59
-
60
-
61
-
62
-
63
-
64
-
65
-
66
-
67
-
68
-
69
-
70
-
71
-
72
-
73
-
74
-
75
-
76
-
77
-
78
-
79
-
80
-
81
-
82
-
83
-
84
-
85
-
86
-
87
-
88
-
89
-
90
-
91
-
92
-
93
-
94
-
95
-
96
-
97
-
98
-
99
-
100
-
101
-
102
 |
 |

040
KIA MOTORS 2006 Annual Report
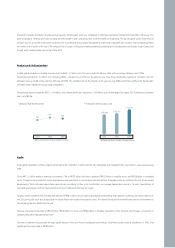
crisis, some of these taxes were exempted or reduced in an attempt to boost domestic consumption, but more fuel-related taxes were imposed to raise funds for
education, to recoup local tax revenue lost from car taxes and to finance funds related to road traffic. In addition to this, automobile emissions are regulated to help
keep the air clean.
Automotive-related laws and regulations differ by country, but the overall trend is toward strengthening environmental and safety rules. In the United States, the
federal government sets the legally permissible levels of automobile emissions, and some states including California enforce their own additional emissions
standards. From 2004, the US government has enforced the Tier II Emissions Standards, which are tougher than the previous National Low Emission Vehicle (NLEV)
program.
The EU is also tightening its emissions regulations. The Euro I emission standards were introduced in 1992 (in 1994 for diesel-powered vehicles) and the tougher
Euro IV standard went into effect in 2005. Euro IV requires carbon monoxide emissions to be no greater than 0.50 grams/kilometer (a sixth of Euro I standard);
hydrocarbons and nitrogen oxides must be lower than 0.30g/km (a quarter); and particulate matter must be no greater than 0.025 grams in every kilometer (a
seventh).
In 2006, the Korean government made three major changes to the automotive-related tax system. First, the partial exemption of the special consumption tax,
which had been in effect since March of 2004, came to an end. This added an additional ₩100,000 to ₩500,000 to the price of each car.
Second, taxes have been hiked on 7 to 10-seater passenger cars. Up until 2004, these 7 to 10-seater passenger cars were classified as a van and subject to relatively
low registration tax and automotive tax. But this favor would no longer be valid from 2005 as taxes would escalate over the next 3 years. Accordingly, registration tax
on these 7 to 10-seater passenger cars was raised to 4.32% of supply price while automotive tax was added 16.5% of difference between vans’ automotive tax and
passenger cars’.
Finally, the price ratio of gasoline to diesel to LPG was revised. While the government initially planned to adjust the ratio to 100:70:65 by 2007, in light of the rising
popularity of diesel-powered vehicles over LPG-fueled cars, the 2006 price ratio of gasoline to diesel to LPG stood at 100:80:50.
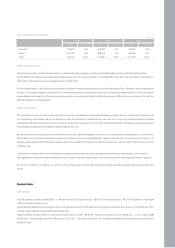
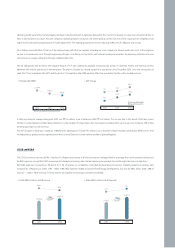
Other Business Related Reference Details
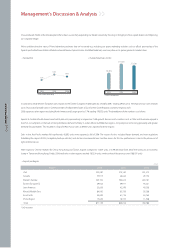
Sales Distribution Channel (2006)
Sex, age group, and income segments
▶As there is a noticeable increase in the influence of females in automobile purchases and with more female drivers on roads, the significance of sex related
segmentation is gradually diluting.
▶The major purchaser groups classified by age and income is as follows.
▷30~40 age group (active economic activity) > 50s age group (most economically stable period) > 20s age group (weak purchasing power)
▷the middle class > the high class > the low class
Per Purchase Type
▶Replacement purchases (65.4%) > Additional purchases (22.6%) > New purchases (12.0%)
Additional purchase + Replacement purchase proportion: 70.2% (1996)
→
88.0% (2005)
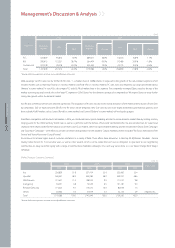
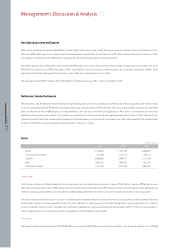
Management’s Discussion & Analysis
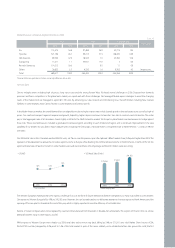
Domestic 18 340 429
Overseas Worldwide including North America ; Overseas sales subsidiaries as the strategic points
Category Regional Headquarters Direct Management Branches Dealerships