Kia 2006 Annual Report Download - page 73
Download and view the complete annual report
Please find page 73 of the 2006 Kia annual report below. You can navigate through the pages in the report by either clicking on the pages listed below, or by using the keyword search tool below to find specific information within the annual report.-
 1
1 -
2
-
3
-
4
-
5
-
6
-
7
-
8
-
9
-
10
-
11
-
12
-
13
-
14
-
15
-
16
-
17
-
18
-
19
-
20
-
21
-
22
-
23
-
24
-
25
-
26
-
27
-
28
-
29
-
30
-
31
-
32
-
33
-
34
-
35
-
36
-
37
-
38
-
39
-
40
-
41
-
42
-
43
-
44
-
45
-
46
-
47
-
48
-
49
-
50
-
51
-
52
-
53
-
54
-
55
-
56
-
57
-
58
-
59
-
60
-
61
-
62
-
 63
63 -
 64
64 -
 65
65 -
 66
66 -
 67
67 -
 68
68 -
 69
69 -
 70
70 -
 71
71 -
 72
72 -
 73
73 -
 74
74 -
 75
75 -
 76
76 -
 77
77 -
 78
78 -
 79
79 -
 80
80 -
 81
81 -
 82
82 -
 83
83 -
84
-
85
-
86
-
87
-
88
-
89
-
90
-
91
-
92
-
93
-
94
-
95
-
96
-
97
-
98
-
99
-
100
-
101
-
102
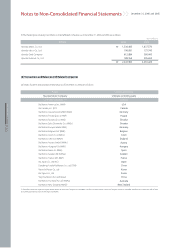
 |
 |

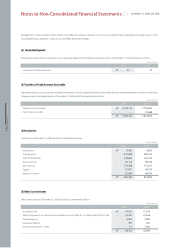
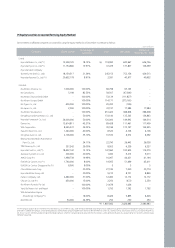
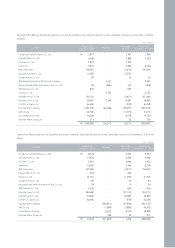
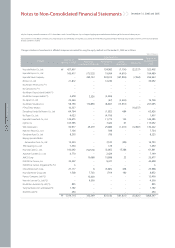
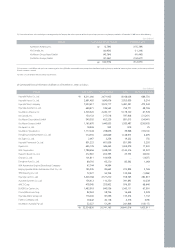
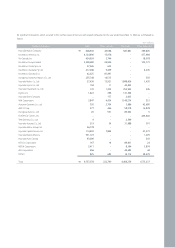
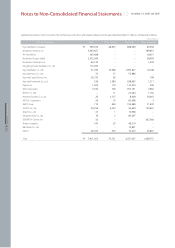
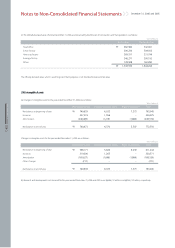
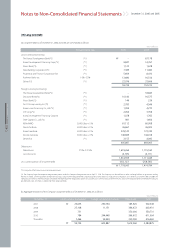
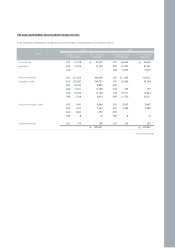
(e) Summarized financial information of affiliates as of December 31, 2006 is as follows:
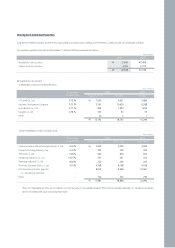
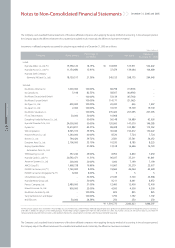
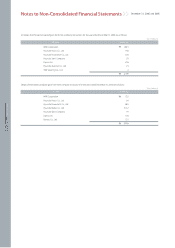
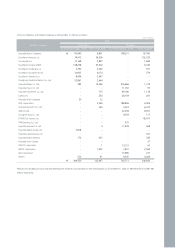
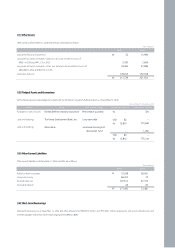
(*1) The cumulative losses and unrealized gains not recognized by the Company due to the suspension of the valuation of equity securities using the equity method as of December 31, 2005 consist of the following :
(*2) Investments in small affiliates with total assets amounting to less than ₩70 billion are recorded at cost, except where the effect of applying the equity method of accounting for investments on the non-consolidated
financial statements is material.
(*3) Others are cash dividends declared and/or impairment loss.
(2,796)
(40,956)
(45,764)
(31,062)
(120,578)
₩
₩
Affiliate Cumulative income (losses) Unrealized gains
(155,399)
(11,216)
(41,445)
(104,617)
(312,677)
Kia Motors America, Inc.
Kia Canada, Inc.
Kia Motors Deutschland GmbH
Kia Motors Europe GmbH
Won (millions)
6,211,000
2,681,482
7,023,617
649,471
2,303,320
150,132
540,502
1,165,670
18,936
1,117,244
714,355
2,067
901,222
695,139
1,788,656
212,661
101,811
89,793
47,744
195,345
72,527
3,403,768
156,412
478,045
1,483,918
82,024
116,200
79,442
52,327
32,534,830
2,671,925
1,690,676
3,523,717
189,562
2,240,177
217,518
652,329
1,440,835
952
728,636
443,669
2,256
601,838
449,465
1,348,230
202,395
104,956
65,370
14,994
85,662
50,704
2,571,270
110,350
255,802
840,556
58,756
87,096
40,178
51,291
20,741,165
8,168,036
3,053,009
5,481,241
794,771
5,178,120
597,908
881,015
1,585,487
819
39,968
1,148,973
19,222
851,599
1,004,079
3,143,316
23,753
-
85,562
-
223,824
132,054
918,765
391,893
976,301
1,543,111
16,654
135,274
4,316
241,946
36,641,016
686,750
9,216
473,543
48,799
67,578
(31,261)
(54,941)
(226,003)
25
(39,012)
4,495
(73)
5,293
17,941
52,222
(8,632)
(1,627)
1,069
-
3,769
(1,086)
282,813
10,238
68,640
67,991
5,228
1,732
(679)
(18,117)
1,425,911
₩
₩
SalesTotal LiabilitiesTotal assetsAffiliate Net income (losses)
Hyundai Mobis Co., Ltd.
Hyundai Hysco Co., Ltd.
Hyundai Steel Company
Hyundai Autonet Co., Ltd.
Kia Motors America, Inc.
Kia Canada, Inc.
Kia Motors Deutschland GmbH
Kia Motors Europe GmbH
Kia Japan Co., Ltd.
Kia Motors Slovakia S.r.o.
Dongfeng Yueda Kia Motors Co., Ltd.
Kia Tigers Co., Ltd.
Hyundai Powertech Co., Ltd.
Dymos Inc.
WIA Corporation
Haevichi Resort Co., Ltd.
Chasan Co., Ltd.
Donghee Auto Co., Ltd.
WIA Automotive Engine (Shandong) Company
Beijing Hyundai Mobis Automotive Parts Co., Ltd.
TRW Steering Co., Ltd.
Hyundai Card Co., Ltd.
Autoever Systems Co., Ltd.
AMCO Corp.
EUKOR Car Carriers, Inc.
China Millennium Corp.
Hyundai-Motor Group Ltd.
Partecs Company, Ltd.
Kia Motors Australia Pty Ltd.
Won (millions)