Kia 2006 Annual Report Download - page 48
Download and view the complete annual report
Please find page 48 of the 2006 Kia annual report below. You can navigate through the pages in the report by either clicking on the pages listed below, or by using the keyword search tool below to find specific information within the annual report.-
 1
1 -
2
-
3
-
4
-
5
-
6
-
7
-
8
-
9
-
10
-
11
-
12
-
13
-
14
-
15
-
16
-
17
-
18
-
19
-
20
-
21
-
22
-
23
-
24
-
25
-
26
-
27
-
28
-
29
-
30
-
31
-
32
-
33
-
34
-
35
-
36
-
37
-
 38
38 -
 39
39 -
 40
40 -
 41
41 -
 42
42 -
 43
43 -
 44
44 -
 45
45 -
 46
46 -
 47
47 -
 48
48 -
 49
49 -
 50
50 -
 51
51 -
 52
52 -
 53
53 -
 54
54 -
 55
55 -
 56
56 -
 57
57 -
 58
58 -
59
-
60
-
61
-
62
-
63
-
64
-
65
-
66
-
67
-
68
-
69
-
70
-
71
-
72
-
73
-
74
-
75
-
76
-
77
-
78
-
79
-
80
-
81
-
82
-
83
-
84
-
85
-
86
-
87
-
88
-
89
-
90
-
91
-
92
-
93
-
94
-
95
-
96
-
97
-
98
-
99
-
100
-
101
-
102
 |
 |
048
KIA MOTORS 2006 Annual Report
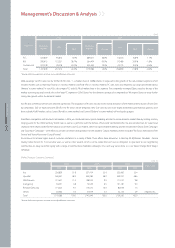
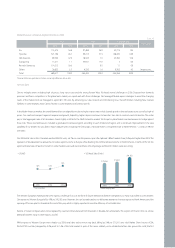
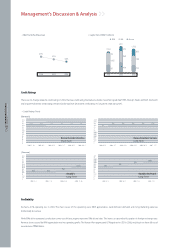
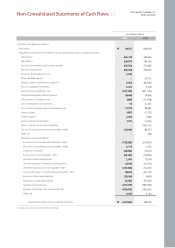
•R&D Trend (% of Revenue)
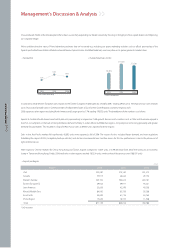
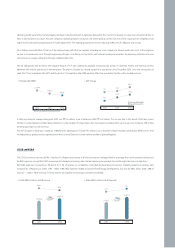
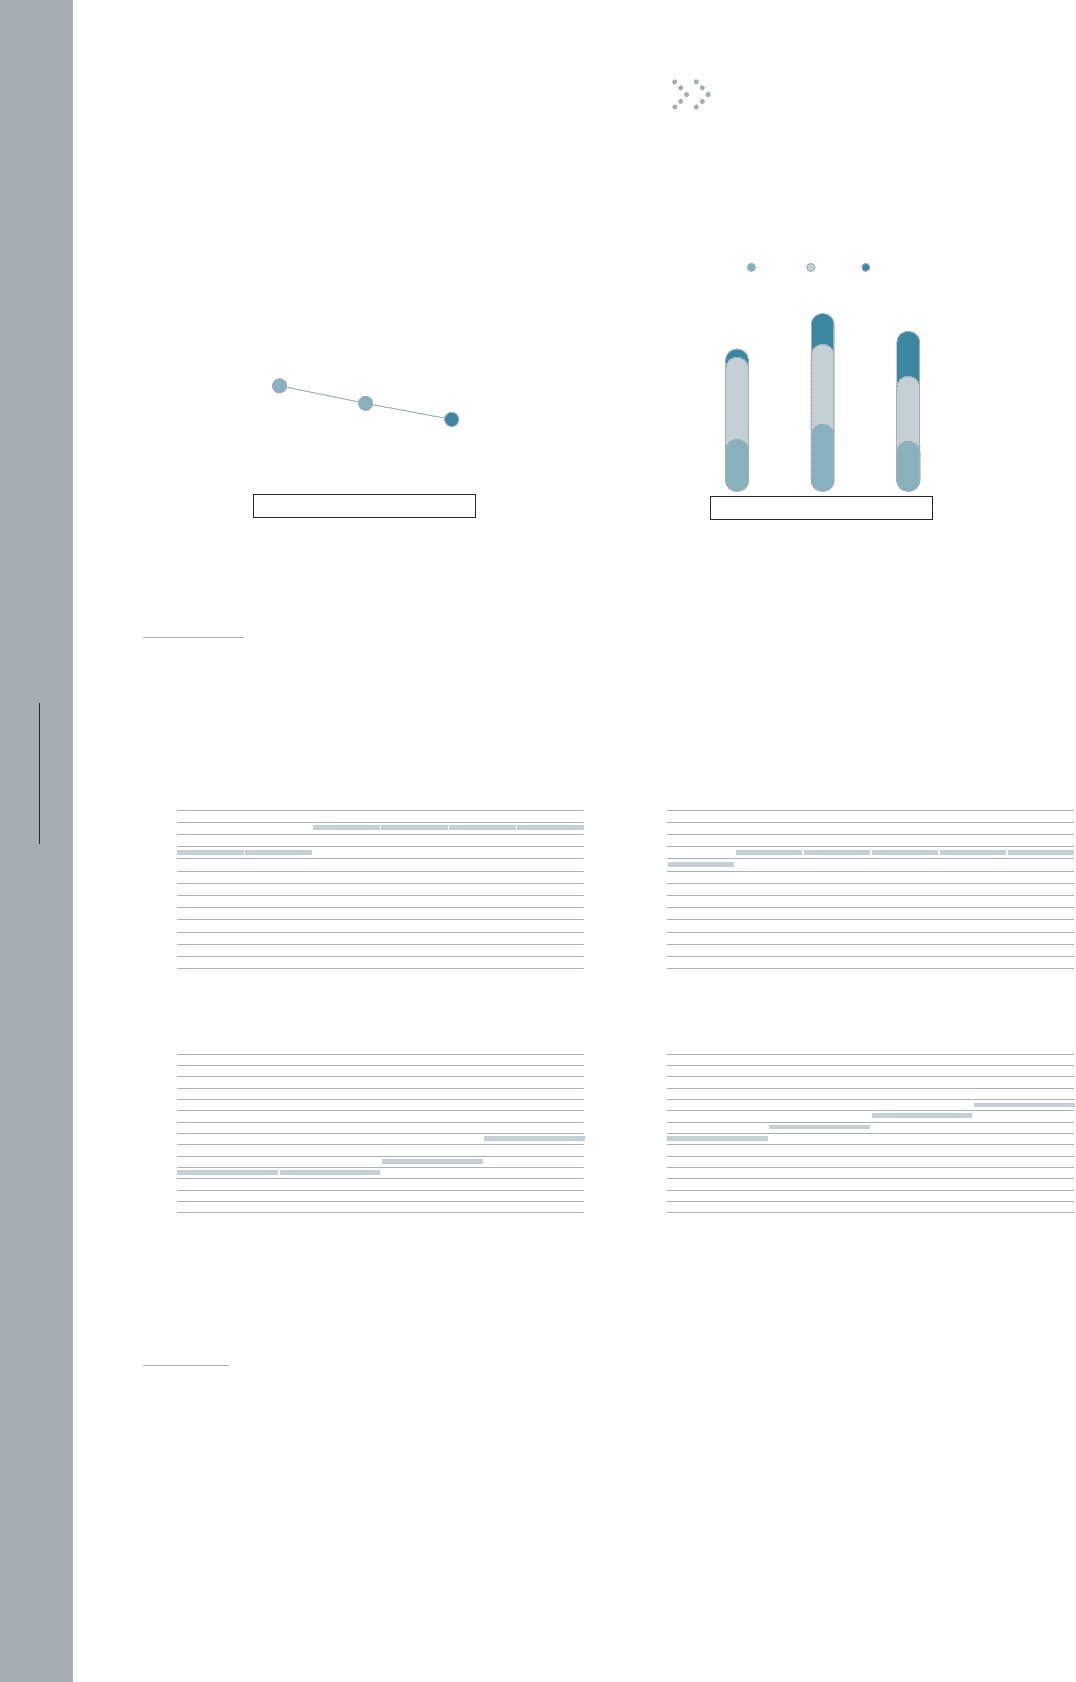
Credit Ratings
There was no change related to credit ratings in 2006. Overseas credit rating maintained a double investment grade (S&P: BBB-, Moody’s: Baa3), and both short-term
and long-term domestic credit ratings remained at the top level (short-term credit rating: A1, long-term credit rating: AA-).
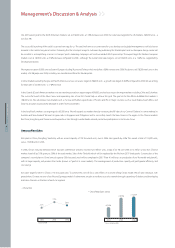
•Credit Ratings Trend
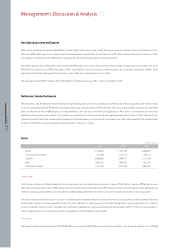
Profitability
Kia had a 0.7% operating loss in 2006. The main causes of this operating were: KRW appreciation, slack domestic demand, and rising marketing expenses
domestically & overseas.
While 90% of the company’s production comes out of Korea, exports represent 76% of total sales. This leaves us exposed to fluctuations in foreign exchange rates.
Revenue losses caused by KRW appreciation eat into operating profits. The Korean Won appreciated 6.7% against the USD in 2006, resulting in an forex fall-out of
around minus ₩800 billion.
Management’s Discussion & Analysis
5.9%
6.9%
4.6%
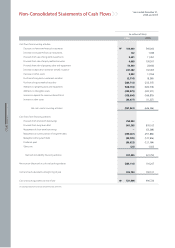
2004 2005 2006 2004
122
1,554
2005
534
1,911
949
428
2006
635
1,756
799
322
1,055
377
OverseasR&DPP&E
A1+
A1
A1-
A2+
A2
A2-
A3+
A3
A3-
B+
B
B-
C
D
2003. 1.10 2003. 6. 5 2004. 6.25 2004. 9. 7 2006. 6.22 2006.10.19 2004. 6.25 2004. 9. 7 2005. 6.14 2006. 6.22 2006.10.19 2007. 1.17
A2+ A2+
[Domestic]
A1A1 A1 A1
AAA
AA+
AA
AA-
A+
A
A-
BBB+
BBB
BBB-
BB
CCC
CC
C
Korea Investors Service
Short-Term
Korea Investors Service
Long-Term
A+ AA- AA- AA- AA- AA-
•CapEx Trend (KRW in billions)
Aaa
Aa
A1
A2
A3
Baa1
Baa2
Baa3
Ba1
Ba2
Ba3
B
Caa
Ca
C
2001. 6. 1 2002. 7. 4 2003. 5.23 2004. 11.26
[Overseas]
AA
A
BBB+
BBB
BBB-
BB+
BB
BB-
B+
B
B-
CCC
CC
C
D
2001. 6. 8 2002. 6.17 2003. 7.22 2005. 11.2
Moody's
Long-Term
Standard & Poor's
Long-Term
BB-
BBB-
BB BB+
Baa3
Ba3 Ba3 Ba2