Kia 2006 Annual Report Download - page 43
Download and view the complete annual report
Please find page 43 of the 2006 Kia annual report below. You can navigate through the pages in the report by either clicking on the pages listed below, or by using the keyword search tool below to find specific information within the annual report.-
 1
1 -
2
-
3
-
4
-
5
-
6
-
7
-
8
-
9
-
10
-
11
-
12
-
13
-
14
-
15
-
16
-
17
-
18
-
19
-
20
-
21
-
22
-
23
-
24
-
25
-
26
-
27
-
28
-
29
-
30
-
31
-
32
-
 33
33 -
 34
34 -
 35
35 -
 36
36 -
 37
37 -
 38
38 -
 39
39 -
 40
40 -
 41
41 -
 42
42 -
 43
43 -
 44
44 -
 45
45 -
 46
46 -
 47
47 -
 48
48 -
 49
49 -
 50
50 -
 51
51 -
 52
52 -
 53
53 -
54
-
55
-
56
-
57
-
58
-
59
-
60
-
61
-
62
-
63
-
64
-
65
-
66
-
67
-
68
-
69
-
70
-
71
-
72
-
73
-
74
-
75
-
76
-
77
-
78
-
79
-
80
-
81
-
82
-
83
-
84
-
85
-
86
-
87
-
88
-
89
-
90
-
91
-
92
-
93
-
94
-
95
-
96
-
97
-
98
-
99
-
100
-
101
-
102
 |
 |

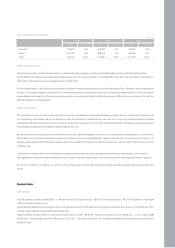
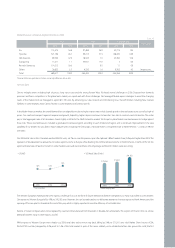
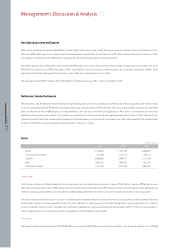
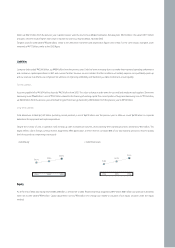
Market Share per Company & Segment (Domestic, 2006)
Overseas Sales
Due to multiple strains including high oil prices, rising input costs and the strong Korean Won, Kia faced several challenges in 2006. Despite these domestic
pressures and fierce competition in the global auto market, we coped well with these challenges. We leveraged flexible export strategies to meet the changing
needs of the market. And we managed to export 871,159 units by enhancing our sales network and introducing new / face-lift models including New Carnival
(‘Sedona’ in some markets), New Carens (‘Rondo’ in some markets) and Sorento face-lift.
In the North American market, the overall demand for cars edged down due to higher interest rates which slowed growth in the real estate sector, as well as high oil
prices. Our small and compact segments experienced growth, helped by higher oil price and new car launches. Van sales in contrast went into decline. The entire
pie, or total aggregate sales of all carmakers, shrank slightly in 2006 for the North American market. Yet Kia put in place flexible countermeasures to hedge against
these risks. These countermeasures included a graduated incentive program according to each model and region, and a continued improvement in the sales
capability of our dealers. Kia was able to export 366,200 units (including the Entourage, a Hyundai Motor’s consignment car) to North America -- a steep 21.4% rise
over 2005.
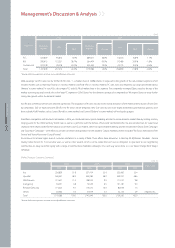
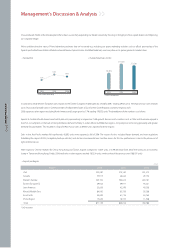
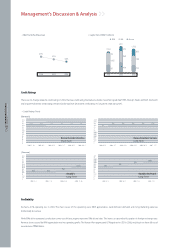
Our 2006 retail sales in the US market reached 294,302 units, a 6.7% rise over the previous year. We captured 1.8% of market share, 0.2% point higher than 2005. The
operation of Slovakia plant has allowed us to reduce export volume to Europe while diverting most of the reduced volume to North America. In terms of the US, the
export and retail sales of Spectra (‘Cerato’ in some markets) were well executed. Sales of our Sportage and Sorento models were also strong.
•US M/S
The Western European market posed some rigorous challenges for us in the form of slower demand and keener competition, as many rivals rolled out new models.
Our exports to Western Europe fell by 19%, to 245,102 units. However, this can be attributed to our deliberate attempt to increase exports to North America and the
opening of the new plant in Slovakia at the end of the year, which is highly expected to raise the efficiency of local retail sales.
Exports of Cerato compact sedan, to be replaced by cee’d and manufactured from the plant in Slovakia, fell substantially. The exports of Picanto mini car, whose
demand has been rising in other regions, also fell.
While exports to Western Europe were sharply cut, 2006 retail sales took a minor step back, falling by 2.4%, to 271,261 units sold. Market Share (source: ACEA,
EU23+EFTA countries) dropped by 0.2% point to 1.4% of the total market. In spite of this minor setback, we’ve established a firm sales ground for cee’d, the first
* Source: Autodata
1.6%
1.6%
1.8%
2004 2005 2006
2004
270,056
2005
275,851
2006
294,302
* Source: Company data
Sales M/S Sales M/S Sales M/S
CommercialPCs RVs Particulars
Kia 115,575 16.8 97,489 36.9 43,775 19.4
Hyundai 321,796 46.7 99,215 37.5 148,430 65.9
GM-Daewoo 89,300 12.9 18,543 7.0 23,784 10.6
Ssangyong 11,611 1.7 44,937 17.0 3 0.0
Renault-Samsung 114,512 16.6 - 0.0 11 0.0
Others 36,823 5.3 4,220 1.6 9,362 4.2 Imports, etc.
Total 689,617 100.0 264,404 100.0 225,365 100.0
(Unit, %)
* Based on KAMA new registrations data; there may be slight differences with our data
•US Retail Sales (Units)