Kia 2006 Annual Report Download - page 80
Download and view the complete annual report
Please find page 80 of the 2006 Kia annual report below. You can navigate through the pages in the report by either clicking on the pages listed below, or by using the keyword search tool below to find specific information within the annual report.-
 1
1 -
2
-
3
-
4
-
5
-
6
-
7
-
8
-
9
-
10
-
11
-
12
-
13
-
14
-
15
-
16
-
17
-
18
-
19
-
20
-
21
-
22
-
23
-
24
-
25
-
26
-
27
-
28
-
29
-
30
-
31
-
32
-
33
-
34
-
35
-
36
-
37
-
38
-
39
-
40
-
41
-
42
-
43
-
44
-
45
-
46
-
47
-
48
-
49
-
50
-
51
-
52
-
53
-
54
-
55
-
56
-
57
-
58
-
59
-
60
-
61
-
62
-
63
-
64
-
65
-
66
-
67
-
68
-
69
-
 70
70 -
 71
71 -
 72
72 -
 73
73 -
 74
74 -
 75
75 -
 76
76 -
 77
77 -
 78
78 -
 79
79 -
 80
80 -
 81
81 -
 82
82 -
 83
83 -
 84
84 -
 85
85 -
 86
86 -
 87
87 -
 88
88 -
 89
89 -
 90
90 -
91
-
92
-
93
-
94
-
95
-
96
-
97
-
98
-
99
-
100
-
101
-
102
 |
 |

080
KIA MOTORS 2006 Annual Report
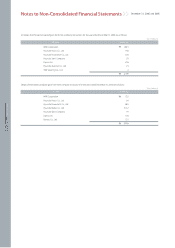
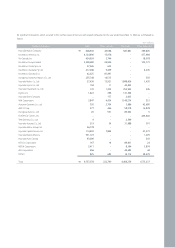
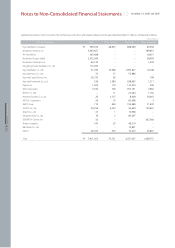
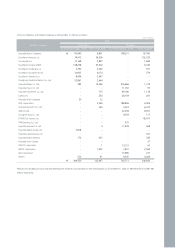
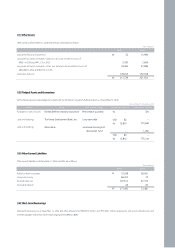
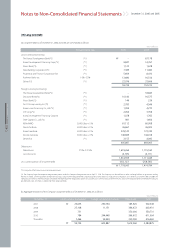
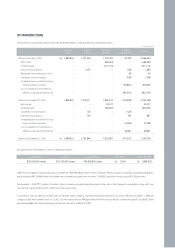
(c) The officially declared value of land at December 31, 2006, as announced by the Minister of Construction and Transportation, is as follows:
The officially declared value, which is used for government purposes, is not intended to represent fair value.
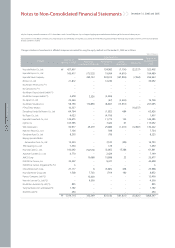
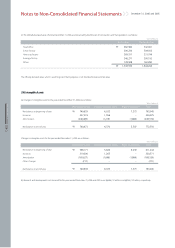
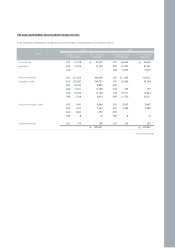
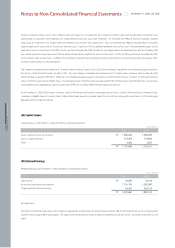
(10) Intangible Assets
(a) Changes in intangible assets for the year ended December 31, 2006 are as follows:
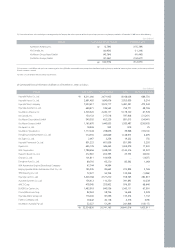
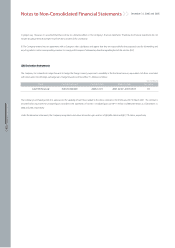
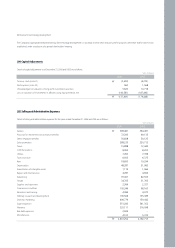
Changes in intangible assets for the year ended December 31, 2005 are as follows:
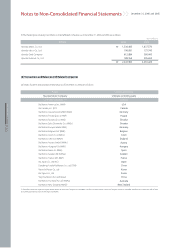
(b) Research and development costs incurred for the years ended December 31, 2006 and 2005 were ₩586,112 million and ₩565,743 million, respectively.
December 31, 2006 and 2005
Notes to Non-Consolidated Financial Statements
282,582
306,234
269,511
346,271
138,938
1,343,536
₩
₩
Book value Declared value
342,061
509,932
331,799
300,192
160,280
1,644,264
Head office
Sohari factory
Hwasung factory
Kwangju factory
Others
Won (millions)
749,639
257,519
(246,485)
760,673
6,033
1,556
(1,219)
6,370
7,373
-
(1,866)
5,507
763,045
259,075
(249,570)
772,550
₩
₩
Right of utilizationIndustrial property rightsDevelopment costs Total
Net balance at beginning of year
Increases
Amortization
Net balance at end of year
Won (millions)
596,171
319,306
(165,627)
(211)
749,639
5,834
1,265
(1,066)
-
6,033
9,239
-
(1,866)
-
7,373
611,244
320,571
(168,559)
(211)
763,045
₩
₩
Right of utilizationIndustrial property rightsDevelopment costs Total
Net balance at beginning of year
Increases
Amortization
Other changes
Net balance at end of year
Won (millions)