Kia 2006 Annual Report Download - page 57
Download and view the complete annual report
Please find page 57 of the 2006 Kia annual report below. You can navigate through the pages in the report by either clicking on the pages listed below, or by using the keyword search tool below to find specific information within the annual report.-
 1
1 -
2
-
3
-
4
-
5
-
6
-
7
-
8
-
9
-
10
-
11
-
12
-
13
-
14
-
15
-
16
-
17
-
18
-
19
-
20
-
21
-
22
-
23
-
24
-
25
-
26
-
27
-
28
-
29
-
30
-
31
-
32
-
33
-
34
-
35
-
36
-
37
-
38
-
39
-
40
-
41
-
42
-
43
-
44
-
45
-
46
-
 47
47 -
 48
48 -
 49
49 -
 50
50 -
 51
51 -
 52
52 -
 53
53 -
 54
54 -
 55
55 -
 56
56 -
 57
57 -
 58
58 -
 59
59 -
 60
60 -
 61
61 -
 62
62 -
 63
63 -
 64
64 -
 65
65 -
 66
66 -
 67
67 -
68
-
69
-
70
-
71
-
72
-
73
-
74
-
75
-
76
-
77
-
78
-
79
-
80
-
81
-
82
-
83
-
84
-
85
-
86
-
87
-
88
-
89
-
90
-
91
-
92
-
93
-
94
-
95
-
96
-
97
-
98
-
99
-
100
-
101
-
102
 |
 |

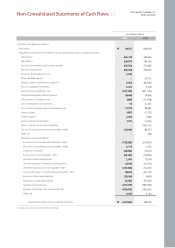
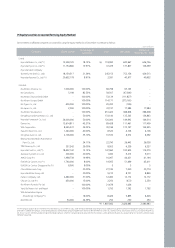
Years ended December 31,
2006 and 2005
Non-Consolidated Statements of Cash Flows
(In millions of Won)
2006 2005
Cash flows from operating activities:
Net income
Adjustments to reconcile net income to net cash provided by (used in) operating activities:
Depreciation
Amortization
Provision for retirement and severance benefits
Provision for warranties
Allowance for doubtful accounts
Other bad debt expense
Foreign currency translation loss (gain), net
Loss on scrapping of inventories
Equity in income of affiliates, net
Dividends from equity method securities
Gain on sale of investments, net
Loss on impairment of investments
Loss on sale of property, plant and equipment, net
Interest income
Interest expense
Gain on valuation of derivatives
Gain on valuation of investment securities
Loss on sale of accounts and notes receivable - trade
Other, net
Changes in assets and liabilities:
Increase in accounts and notes receivable - trade
Decrease in long-term accounts receivable - trade
Increase in inventories
Increase in accounts receivable - other
Decrease in other current assets
Decrease (increase) in deferred income tax assets
Decrease in accounts and notes payable - trade
Increase (decrease) in accounts and notes payable - other
Increase in other current liabilities
Decrease in income taxes payable
Payment of warranty costs
Payment of retirement and severance benefits
Other, net
Net cash provided by (used in) operating activities
39,337
460,149
249,570
357,508
246,556
2,924
-
6,428
6,401
(277,755)
34,648
(345)
57
21,278
(427)
2,093
(111)
-
124,096
-
(738,538)
2,175
(38,904)
(43,129)
2,097
22,344
(274,156)
98,623
198,030
(2,244)
(267,219)
(472,676)
9,640
(231,550)
680,904
444,256
168,559
270,082
245,440
-
20,112
(88,244)
5,008
(431,140)
34,460
(71,638)
27,421
89,967
(1,535)
1,889
(3,050)
(145,155)
86,173
(88)
(274,923)
3,243
(6,247)
(79,883)
15,914
(16,762)
(16,873)
(20,779)
8,408
(42,062)
(285,596)
(185,265)
6,164
438,760
₩
₩
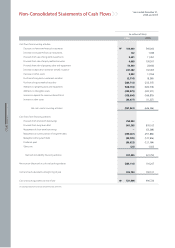
See accompanying notes to non-consolidated financial statements.