Kia 2006 Annual Report Download - page 67
Download and view the complete annual report
Please find page 67 of the 2006 Kia annual report below. You can navigate through the pages in the report by either clicking on the pages listed below, or by using the keyword search tool below to find specific information within the annual report.-
 1
1 -
2
-
3
-
4
-
5
-
6
-
7
-
8
-
9
-
10
-
11
-
12
-
13
-
14
-
15
-
16
-
17
-
18
-
19
-
20
-
21
-
22
-
23
-
24
-
25
-
26
-
27
-
28
-
29
-
30
-
31
-
32
-
33
-
34
-
35
-
36
-
37
-
38
-
39
-
40
-
41
-
42
-
43
-
44
-
45
-
46
-
47
-
48
-
49
-
50
-
51
-
52
-
53
-
54
-
55
-
56
-
 57
57 -
 58
58 -
 59
59 -
 60
60 -
 61
61 -
 62
62 -
 63
63 -
 64
64 -
 65
65 -
 66
66 -
 67
67 -
 68
68 -
 69
69 -
 70
70 -
 71
71 -
 72
72 -
 73
73 -
 74
74 -
 75
75 -
 76
76 -
 77
77 -
78
-
79
-
80
-
81
-
82
-
83
-
84
-
85
-
86
-
87
-
88
-
89
-
90
-
91
-
92
-
93
-
94
-
95
-
96
-
97
-
98
-
99
-
100
-
101
-
102
 |
 |

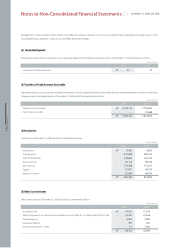
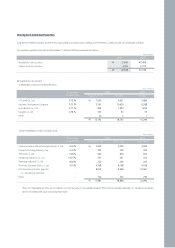
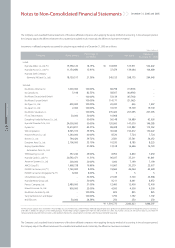
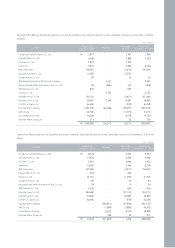
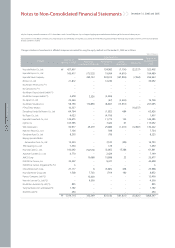
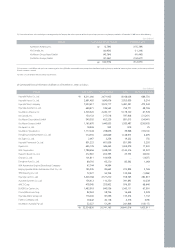
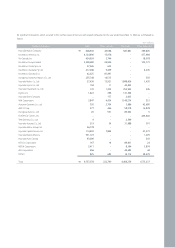
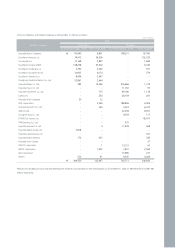
(7) Equity Securities Accounted for Using Equity Method
(a) Investments in affiliated companies accounted for using the equity method as of December 31, 2006 are as follows:
15,558,120
11,154,680
18,159,517
20,652,178
1,000,000
5,198
-
-
400,000
2,000
-
-
24,000,000
13,614,811
8,545,372
1,240,000
2,106,000
-
357,242
18,422,142
200,000
1,998,738
1,760,000
8,000
-
-
2,480,000
450,000
-
-
-
50,000
18.13%
13.91%
21.39%
8.91%
100.00%
82.53%
100.00%
100.00%
100.00%
100.00%
100.00%
50.00%
50.00%
45.37%
39.33%
40.00%
35.10%
24.11%
29.00%
12.12%
20.00%
19.99%
8.00%
8.00%
30.30%
30.00%
31.00%
15.00%
100.00%
100.00%
18.00%
24.39%
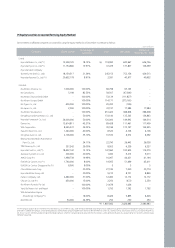
118,993
37,479
245,153
2,581
66,798
58,507
53,139
114,171
20,300
33,197
451,422
133,140
120,000
89,438
30,184
8,520
10,530
22,790
8,952
147,960
1,000
10,067
19,565
5
27,185
9,212
12,400
2,250
21,676
1,792
8,426
250
1,887,082
620,967
137,807
752,156
40,977
63,143
(67,386)
(111,827)
(275,165)
(189)
17,984
388,608
135,343
149,692
111,461
173,197
4,106
8,572
26,443
6,329
100,905
9,213
44,421
51,469
5
7,050
8,731
12,172
(472)
1,036
1,792
5,895
250
2,424,685
626,726
106,599
429,513
40,952
-
-
-
-
-
17,984
388,608
136,843
149,314
117,409
154,925
4,106
8,592
26,038
6,327
119,370
9,213
41,194
45,411
5
20,774
8,890
12,172
2,250
-
1,792
8,426
250
2,483,683
₩
₩
Net assetsCost
Percentage of
ownership
Shares ownedCompany Balance at
December 31, 2006
Listed:
Hyundai Mobis Co., Ltd.(*1)
Hyundai Hysco Co., Ltd.(*1)
Hyundai Steel Company
(formerly, INI Steel Co., Ltd.)
Hyundai Autonet Co., Ltd.(*1)
Unlisted:
Kia Motors America, Inc.
Kia Canada, Inc.
Kia Motors Deutschland GmbH
Kia Motors Europe GmbH
Kia Tigers Co., Ltd.
Kia Japan Co., Ltd.
Kia Motors Slovakia S.r.o.
Dongfeng Yueda Kia Motors Co., Ltd.
Hyundai Powertech Co., Ltd.
Dymos Inc.
WIA Corporation
Haevichi Resort Co., Ltd.
Donghee Auto Co., Ltd.
Beijing Hyundai Mobis Automotive
Parts Co., Ltd.
TRW Steering Co., Ltd.
Hyundai Card Co., Ltd.(*1)
Autoever Systems Co., Ltd.
AMCO Corp.(*1)
EUKOR Car Carriers, Inc.(*1)
EUKOR Car Carriers Singapore Pte.(*1)
China Millennium Corp.
Hyundai-Motor Group Ltd.
Partecs Company, Ltd.
Chasan Co., Ltd.(*1)
Kia Motors Australia Pty Ltd.
Yanji Kia Motors A/s and Repair
WIA Automotive Engine
(Shandong) Company(*1)
NGVTEK.com
Won (millions)
(*1) The Company accounts for its investment in Hyundai Mobis Co., Ltd. and AMCO Corp., under the equity method of accounting due to its significant management control even though the Company’s ownership is
under 20%. In addition, the Company and its holding company, Hyundai Motor Company, together own more than 20% of EUKOR Car Carriers, Inc., Hyundai Card Co., Ltd, Hyundai Hysco Co., Ltd., Hyundai Autonet Co.,
Ltd., Chasan Co., Ltd. and WIA Automotive Engine (Shandong) Company, which the Company generally presumed that the investee is under significant influence, thus accounting for its investment under the equity
method of accounting.