Kia 2006 Annual Report Download - page 58
Download and view the complete annual report
Please find page 58 of the 2006 Kia annual report below. You can navigate through the pages in the report by either clicking on the pages listed below, or by using the keyword search tool below to find specific information within the annual report.-
 1
1 -
2
-
3
-
4
-
5
-
6
-
7
-
8
-
9
-
10
-
11
-
12
-
13
-
14
-
15
-
16
-
17
-
18
-
19
-
20
-
21
-
22
-
23
-
24
-
25
-
26
-
27
-
28
-
29
-
30
-
31
-
32
-
33
-
34
-
35
-
36
-
37
-
38
-
39
-
40
-
41
-
42
-
43
-
44
-
45
-
46
-
47
-
 48
48 -
 49
49 -
 50
50 -
 51
51 -
 52
52 -
 53
53 -
 54
54 -
 55
55 -
 56
56 -
 57
57 -
 58
58 -
 59
59 -
 60
60 -
 61
61 -
 62
62 -
 63
63 -
 64
64 -
 65
65 -
 66
66 -
 67
67 -
 68
68 -
69
-
70
-
71
-
72
-
73
-
74
-
75
-
76
-
77
-
78
-
79
-
80
-
81
-
82
-
83
-
84
-
85
-
86
-
87
-
88
-
89
-
90
-
91
-
92
-
93
-
94
-
95
-
96
-
97
-
98
-
99
-
100
-
101
-
102
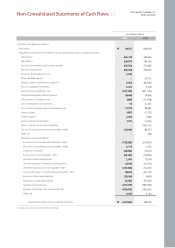
 |
 |
058
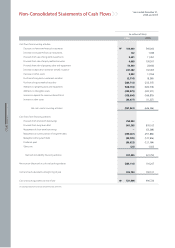
KIA MOTORS 2006 Annual Report
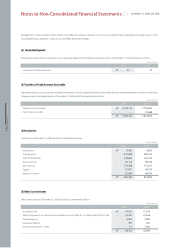
Years ended December 31,
2006 and 2005
Non-Consolidated Statements of Cash Flows
(In millions of Won)
2006 2005
Cash flows from investing activities:
Decrease in short-term financial instruments
Decrease in long-term financial instruments
Proceeds from sale of long-term investments
Proceeds from sale of equity method securities
Proceeds from sale of property, plant and equipment
Decrease in deposit for severance benefit insurance
Decrease in other assets
Purchase of long-term investment securities
Purchase of equity method securities
Additions to property, plant and equipment
Additions to intangible assets
Increase in deposit for severance benefit trust
Increase in other assets
Net cash used in investing activities
Cash flows from financing activities:
Proceeds from short-term borrowings
Proceeds from long-term debt
Repayment of short-term borrowings
Repayment of current portion of long-term debt
Repayment of long-term debt
Dividends paid
Other, net
Net cash provided by financing activities
Net increase (decrease) in cash and cash equivalents
Cash and cash equivalents at beginning of year
Cash and cash equivalents at end of year
100,000
122
3,691
4,668
50,300
241,262
8,842
(2,714)
(385,713)
(528,763)
(259,075)
(158,604)
(35,077)
(961,061)
350,843
861,305
-
(259,267)
(58,735)
(86,623)
(28)
807,495
(385,116)
906,724
521,608
560,000
1,949
11,457
195,501
28,640
102,453
13,554
(8,399)
(232,315)
(820,518)
(320,571)
(166,870)
(11,227)
(646,346)
-
876,103
(53,268)
(257,894)
(121,906)
(121,164)
1,922
323,793
116,207
790,517
906,724
₩
₩
See accompanying notes to non-consolidated financial statements.