IBM 2001 Annual Report Download - page 96
Download and view the complete annual report
Please find page 96 of the 2001 IBM annual report below. You can navigate through the pages in the report by either clicking on the pages listed below, or by using the keyword search tool below to find specific information within the annual report.-
 1
1 -
2
-
3
-
4
-
5
-
6
-
7
-
8
-
9
-
10
-
11
-
12
-
13
-
14
-
15
-
16
-
17
-
18
-
19
-
20
-
21
-
22
-
23
-
24
-
25
-
26
-
27
-
28
-
29
-
30
-
31
-
32
-
33
-
34
-
35
-
36
-
37
-
38
-
39
-
40
-
41
-
42
-
43
-
44
-
45
-
46
-
47
-
48
-
49
-
50
-
51
-
52
-
53
-
54
-
55
-
56
-
57
-
58
-
59
-
60
-
61
-
62
-
63
-
64
-
65
-
66
-
67
-
68
-
69
-
70
-
71
-
72
-
73
-
74
-
75
-
76
-
77
-
78
-
79
-
80
-
81
-
82
-
83
-
84
-
85
-
 86
86 -
 87
87 -
 88
88 -
 89
89 -
 90
90 -
 91
91 -
 92
92 -
 93
93 -
 94
94 -
 95
95 -
 96
96 -
 97
97 -
 98
98 -
 99
99 -
 100
100 -
 101
101 -
 102
102 -
 103
103 -
 104
104 -
 105
105 -
 106
106 -
107
-
108
-
109
-
110
-
111
-
112
 |
 |

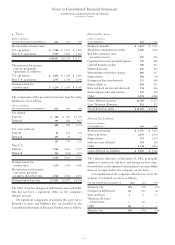
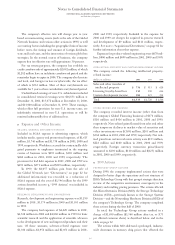
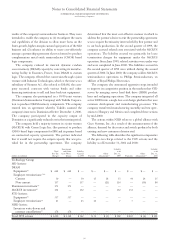
Notes to Consolidated Financial Statements
INTERNATIONAL BUSINESS MACHINES CORPORATION
and Subsidiary Companies
94
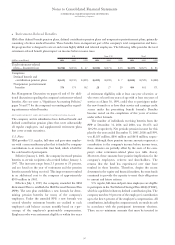
Stock options to purchase 67,596,737 common shares in
2001, 34,633,343 common shares in 2000 and 27,355,056
common shares in 1999 were outstanding, but were not
included in the computation of diluted earnings per share
because the exercise price of the options was greater than
the average market price of the common shares and, there-
fore, the effect would have been antidilutive. Net income
applicable to common stockholders excludes preferred
stock dividends of $10 million in 2001 and $20 million in
both 2000 and 1999.
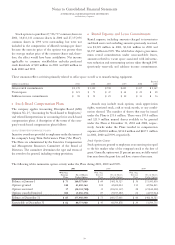
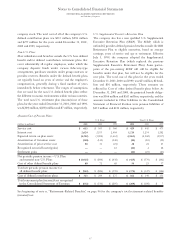
sRental Expense and Lease Commitments
Rental expense, including amounts charged to inventories
and fixed assets and excluding amounts previously reserved,
was $1,349 million in 2001, $1,366 million in 2000 and
$1,397 million in 1999. The table below depicts gross mini-
mum rental commitments under noncancelable leases,
amounts related to vacant space associated with infrastruc-
ture reduction and restructuring actions taken through 1993
(previously reserved), and sublease income commitments.
These amounts reflect activities primarily related to office space as well as to manufacturing equipment.
Beyond
(dollars in millions) 2002 2003 2004 2005 2006 2006
Gross rental commitments $«1,378 $«1,129 $«798 $«625 $«437 $«1,367
Vacant space $««««121 $««««««75 $«««47 $«««42 $«««25 $««««««90
Sublease income commitments $««««««58 $««««««32 $«««25 $«««19 $«««13 $««««««36
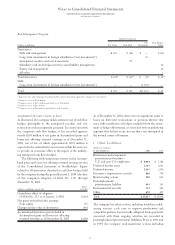
tStock-Based Compensation Plans
The company applies Accounting Principles Board (APB)
Opinion No. 25, “Accounting for Stock Issued to Employees,”
and related Interpretations in accounting for its stock-based
compensation plans. A description of the terms of the com-
pany’s stock-based compensation plans follows:
LONG-TERM PERFORMANCE PLANS
Incentive awards are provided to employees under the terms of
the company’s Long-Term Performance Plans (“the Plans”).
The Plans are administered by the Executive Compensation
and Management Resources Committee of the Board of
Directors. The committee determines the type and terms of
the awards to be granted, including vesting provisions.
Awards may include stock options, stock appreciation
rights, restricted stock, cash or stock awards, or any combi-
nation thereof. The number of shares that may be issued
under the Plans is 231.6 million. There were 193.4 million
and 121.9 million unused shares available to be granted
under the Plans at December 31, 2001 and 2000, respec-
tively. Awards under the Plans resulted in compensation
expense of $169.8 million, $134.0 million and $267.3 million
in 2001, 2000 and 1999, respectively.
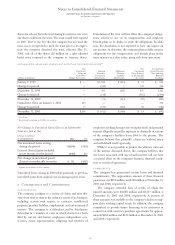
Stock Option Grants
Stock options are granted to employees at an exercise price equal
to the fair market value of the company’s stock at the date of
grant. Generally, options vest 25 percent per year, are fully vested
four years from the grant date and have a term of ten years.
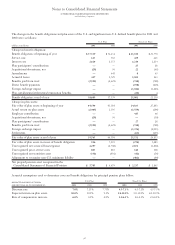
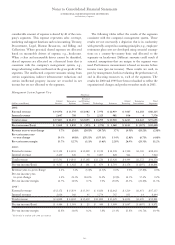
The following tables summarize option activity under the Plans during 2001, 2000 and 1999:
2001 2000 1999
Wtd. Avg. Wtd. Avg. Wtd. Avg.
Exercise No. of Shares Exercise No. of Shares Exercise No. of Shares
Price Under Option Price Under Option Price Under Option
Balance at January 1 $««73 160,557,003 $««60 146,136,523 $««36 131,443,850
Options granted 110 43,410,364 102 42,601,014 115 42,786,845
Options exercised 37 (20,354,701)) 35 (18,243,347) 28 (23,160,228)
Options canceled/expired 100 (5,656,176) 87 (9,937,187) 61 (4,933,944)
Balance at December 31 $««85 177,956,490 $««73 160,557,003 $««60 146,136,523
Exercisable at December 31 $««62 80,773,980 $««45 66,599,878 $««29 51,599,735