IBM 2001 Annual Report Download - page 63
Download and view the complete annual report
Please find page 63 of the 2001 IBM annual report below. You can navigate through the pages in the report by either clicking on the pages listed below, or by using the keyword search tool below to find specific information within the annual report.-
 1
1 -
2
-
3
-
4
-
5
-
6
-
7
-
8
-
9
-
10
-
11
-
12
-
13
-
14
-
15
-
16
-
17
-
18
-
19
-
20
-
21
-
22
-
23
-
24
-
25
-
26
-
27
-
28
-
29
-
30
-
31
-
32
-
33
-
34
-
35
-
36
-
37
-
38
-
39
-
40
-
41
-
42
-
43
-
44
-
45
-
46
-
47
-
48
-
49
-
50
-
51
-
52
-
 53
53 -
 54
54 -
 55
55 -
 56
56 -
 57
57 -
 58
58 -
 59
59 -
 60
60 -
 61
61 -
 62
62 -
 63
63 -
 64
64 -
 65
65 -
 66
66 -
 67
67 -
 68
68 -
 69
69 -
 70
70 -
 71
71 -
 72
72 -
 73
73 -
74
-
75
-
76
-
77
-
78
-
79
-
80
-
81
-
82
-
83
-
84
-
85
-
86
-
87
-
88
-
89
-
90
-
91
-
92
-
93
-
94
-
95
-
96
-
97
-
98
-
99
-
100
-
101
-
102
-
103
-
104
-
105
-
106
-
107
-
108
-
109
-
110
-
111
-
112
 |
 |

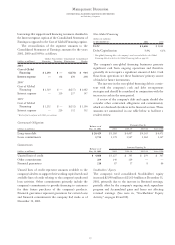
companies. In addition, computer-aided three-dimensional
interactive application (CATIA) related products revenue
decreased in 2001 versus 2000, and their revenue grew
slightly in 2000 versus 1999.
The gross profit dollars from Enterprise Investments/
Other declined 21.0 percent in 2001 versus 2000 and increased
0.9 percent in 2000 versus 1999. The Enterprise Investments/
Other gross profit margin declined 1.8 points in 2001
following an increase of 8.3 points in 2000 versus 1999. The
decline in 2001 gross profit dollars and margin was primarily
a result of lower revenue in 2001 as compared to 2000. The
increase in 2000 gross profit dollars and margin was primarily
due to a shift in the mix of revenue to products that have a
higher gross profit margin than the product lines the
company discontinued in 1999.
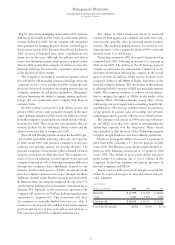
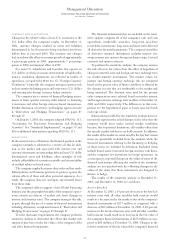
EXPENSE AND OTHER INCOME
Amounts within the Expense and Other Income section of
the Consolidated Statement of Earnings have been reclas-
sified to provide additional details. See “Reclassifications,”
on page 79.
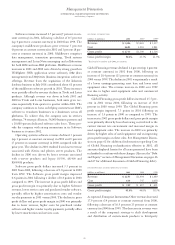
(dollars in millions) 2001 2000*1999*
Selling, general and
administrative $«17,197 $«17,535 $«16,294
Percentage of revenue 20.0% 19.8% 18.6%
Research, development
and engineering «««5,290 «««5,374 «««5,505
Percentage of revenue 6.2% 6.1% 6.3%
Intellectual property
and custom
development income «««(1,535) «««(1,728) «««(1,506)
Other (income) and expense««««««««««(361) «««««(1,008) «««««(848)
Interest expense ««««««238 ««««««347 ««««««352
To tal expense and
other income $«20,829 $«20,520 $«19,797
*Reclassified to conform with 2001 presentation.
Selling, general and administrative (SG&A) expense declined
1.9 percent in 2001 versus 2000, following an increase of
7.6 percent in 2000 compared with 1999.
See “Expense and Other Income,” on page 76 for a
description of the expenses.
The company continued to reduce its SG&A expense by
using technology to improve its efficiency. The increased use
of e-procurement, ibm.com, e-Care for customer support
and other actions related to the company’s ongoing e-business
transformation resulted in substantial productivity improve-
ments in 2001. In addition, the company continued to
reduce discretionary spending such as travel and consulting
in 2001 and benefited from lower goodwill amortization
expense during the year as goodwill relating to several older
acquisitions became fully amortized. The decreases were
partially offset by higher charges taken for workforce rebal-
ancing actions and bad debt expense in 2001 versus 2000.
Future levels of SG&A expense arising from bad debt expense
will depend upon the prevailing economic conditions, esti-
mated value of collateral, and the overall health of and any
concentrations in the company’s receivables portfolio.
The increase in 2000 SG&A expense was primarily driven
by the 1999 net pre-tax benefit of $2,107 million associated
with the sale of the Global Network, actions taken by the
company in 1999 to improve its competitiveness and to
strengthen the company’s overall business portfolio, and
implementation of a change in personal computers’ deprecia-
ble lives. (See “Divestitures,” on page 82, and note q, “1999
Actions,” on pages 91 through 93 for further information.)
Excluding the 1999 actions and sale of the Global Network,
2000 SG&A expense would have declined 4.7 percent versus
1999. In addition, the percentage of revenue would have
been 21.0 percent for 1999.
As described in “New Standards to be Implemented,” on
pages 80 and 81, the company adopted new accounting rules
that eliminate the amortization of goodwill on January 1, 2002.
The new rules also provide for no goodwill amortization on
any acquisitions that occurred after June 30, 2001. The amount
of goodwill amortization, net of tax, that was recorded in
2001, 2000 and 1999 was $262 million, $436 million, and
$420 million, respectively. The amount of goodwill amorti-
zation, net of tax, that would have been recorded in 2002 if the
new rules were not adopted on January 1, 2002, (excluding
the Informix acquisition that occurred after June 30, 2001,
and any other post-2001 acquisition) would have been
$244 million.
Research, development and engineering (RD&E) expense
declined 1.6 percent in 2001 from 2000, following a decrease
of 2.4 percent in 2000 from 1999. The decline in 2001 was a
result of actions taken to reduce overhead. In addition, the
company reprioritized its spending to increase its investment
in high-growth opportunities such as e-business, initiatives
to support Linux and middleware software products. In
addition, as discussed on page 59, the company is also invest-
ing in project eLiza that will deliver self managing systems
technology across its entire e-server product portfolio,
within the next five years. The decline in 2000 is primarily
due to a $111 million pre-tax charge taken in 1999 for
acquired in-process research and development (IPR&D)
associated with the acquisition of Sequent Computer
Systems, Inc., Mylex Corporation and DASCOM, Inc. See
note c, “Acquisitions/Divestitures,” on page 82 for further
detail about the IPR&D charge.
Management Discussion
INTERNATIONAL BUSINESS MACHINES CORPORATION
and Subsidiary Companies
61