IBM 2001 Annual Report Download - page 89
Download and view the complete annual report
Please find page 89 of the 2001 IBM annual report below. You can navigate through the pages in the report by either clicking on the pages listed below, or by using the keyword search tool below to find specific information within the annual report.-
 1
1 -
2
-
3
-
4
-
5
-
6
-
7
-
8
-
9
-
10
-
11
-
12
-
13
-
14
-
15
-
16
-
17
-
18
-
19
-
20
-
21
-
22
-
23
-
24
-
25
-
26
-
27
-
28
-
29
-
30
-
31
-
32
-
33
-
34
-
35
-
36
-
37
-
38
-
39
-
40
-
41
-
42
-
43
-
44
-
45
-
46
-
47
-
48
-
49
-
50
-
51
-
52
-
53
-
54
-
55
-
56
-
57
-
58
-
59
-
60
-
61
-
62
-
63
-
64
-
65
-
66
-
67
-
68
-
69
-
70
-
71
-
72
-
73
-
74
-
75
-
76
-
77
-
78
-
 79
79 -
 80
80 -
 81
81 -
 82
82 -
 83
83 -
 84
84 -
 85
85 -
 86
86 -
 87
87 -
 88
88 -
 89
89 -
 90
90 -
 91
91 -
 92
92 -
 93
93 -
 94
94 -
 95
95 -
 96
96 -
 97
97 -
 98
98 -
 99
99 -
100
-
101
-
102
-
103
-
104
-
105
-
106
-
107
-
108
-
109
-
110
-
111
-
112
 |
 |

Notes to Consolidated Financial Statements
INTERNATIONAL BUSINESS MACHINES CORPORATION
and Subsidiary Companies
87
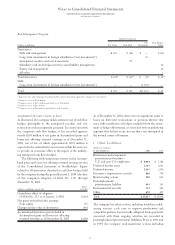
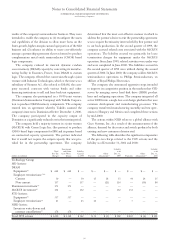
Risk Management Program
Hedge Designation
Net Non-Hedge/
(dollars in millions) Fair Value Cash Flow Investment Other
Derivatives:
Debt risk management $«301 $««(26) $«««««««— $«(13)
Long-term investments in foreign subsidiaries (“net investments”) 92
Anticipated royalties and cost transactions ««««375 ««
Subsidiary cash and foreign currency asset/liability management «««« « «16
Equity risk management «««« « «22
All other 3
Total derivatives $«301(1) $«349(2) $«««««««92(3) $««28 (4)
Debt:
Long-term investments in foreign subsidiaries (“net investments”) ——(5,519) *—
Total $«301 $«349 $«(5,427) $««28
*Represents fair value of foreign denominated debt issuances formally designated as a hedge of net investments.
(1) Comprises assets of $301 million.
(2) Comprises assets of $383 million and liabilities of $34 million.
(3) Comprises assets of $92 million.
(4) Comprises assets of $60 million and liabilities of $32 million.
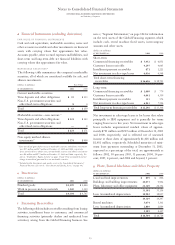
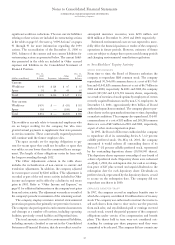
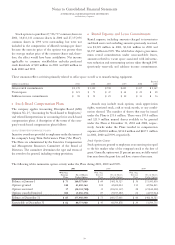
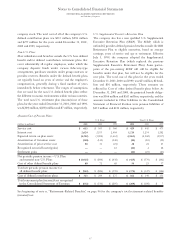
Accumulated Derivative Gains or Losses
As illustrated, the company makes extensive use of cash flow
hedges, principally in the anticipated royalties and cost
transactions risk management program. In connection with
the company’s cash flow hedges, it has recorded approxi-
mately $296 million of net gains in Accumulated gains and
losses not affecting retained earnings as of December 31,
2001, net of tax, of which approximately $276 million is
expected to be reclassified to net income within the next year
to provide an economic offset to the impact of the underly-
ing anticipated cash flows hedged.
The following table summarizes activity in the Accumu-
lated gains and losses not affecting retained earnings section
of the Consolidated Statement of Stockholders’ Equity
related to all derivatives classified as cash flow hedges held
by the company during the period January 1, 2001 (the date
of the company’s adoption of SFAS No. 133) through
December 31, 2001:
Debit/
(dollars in millions, net of tax) (Credit)
Cumulative effect of adoption
of SFAS No. 133 as of January 1, 2001 $«(219)
Net gains reclassified into earnings
from equity 379
Changes in fair value of derivatives (456)
Accumulated derivative gain included in
Accumulated gains and losses not affecting
retained earnings as of December 31, 2001 $«(296)
As of December 31, 2001, there were no significant gains or
losses on derivative transactions or portions thereof that
were either ineffective as hedges, excluded from the assess-
ment of hedge effectiveness, or associated with an underlying
exposure that did not occur; nor are there any anticipated in
the normal course of business.
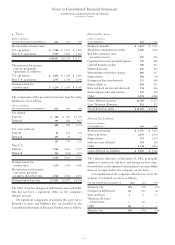
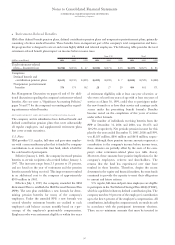
lOther Liabilities
(dollars in millions)
AT DE CEMBER 31: 2001 2000
Retirement and nonpension
postretirement benefits
—
U.S. and non-U.S. employees $«««8,044 $«««7,128
Deferred income taxes 1,593 1,623
Deferred income 1,145 1,266
Executive compensation accruals 868 769
Restructuring actions 589 854
Postemployment/
preretirement liability 493 585
Environmental accruals 215 226
Other 670 497
Total $«13,617 $«12,948
The company has taken actions, including workforce rebal-
ancing actions, each year to improve productivity and
competitive position. Contractually obligated future payments
associated with these ongoing activities are recorded in
postemployment/preretirement liabilities. Prior to 1994 and
in 1999, the company took significant actions including