IBM 2001 Annual Report Download - page 59
Download and view the complete annual report
Please find page 59 of the 2001 IBM annual report below. You can navigate through the pages in the report by either clicking on the pages listed below, or by using the keyword search tool below to find specific information within the annual report.-
 1
1 -
2
-
3
-
4
-
5
-
6
-
7
-
8
-
9
-
10
-
11
-
12
-
13
-
14
-
15
-
16
-
17
-
18
-
19
-
20
-
21
-
22
-
23
-
24
-
25
-
26
-
27
-
28
-
29
-
30
-
31
-
32
-
33
-
34
-
35
-
36
-
37
-
38
-
39
-
40
-
41
-
42
-
43
-
44
-
45
-
46
-
47
-
48
-
 49
49 -
 50
50 -
 51
51 -
 52
52 -
 53
53 -
 54
54 -
 55
55 -
 56
56 -
 57
57 -
 58
58 -
 59
59 -
 60
60 -
 61
61 -
 62
62 -
 63
63 -
 64
64 -
 65
65 -
 66
66 -
 67
67 -
 68
68 -
 69
69 -
70
-
71
-
72
-
73
-
74
-
75
-
76
-
77
-
78
-
79
-
80
-
81
-
82
-
83
-
84
-
85
-
86
-
87
-
88
-
89
-
90
-
91
-
92
-
93
-
94
-
95
-
96
-
97
-
98
-
99
-
100
-
101
-
102
-
103
-
104
-
105
-
106
-
107
-
108
-
109
-
110
-
111
-
112
 |
 |

57
Management Discussion
INTERNATIONAL BUSINESS MACHINES CORPORATION
and Subsidiary Companies
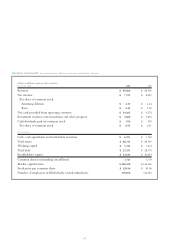
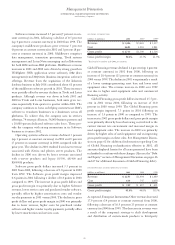
Results of Operations
(dollars in millions except per share amounts)
FOR THE YEAR ENDED DECEMBER 31: 2001 2000*1999*
Revenue $«85,866 $«88,396 $«87,548
Cost 54,084 56,342 55,994
Gross profit 31,782 32,054 31,554
Gross profit margin 37.0% 36.3% 36.0%
To tal expense and
other income 20,829 20,520 19,797
Income before
income taxes «10,953 «11,534 «11,757
Net income $«««7,723 $«÷8,093 $«««7,712
Earnings per share
of common stock:
Assuming dilution $«««««4.35 $÷÷«4.44 $«««««4.12
Basic $«««««4.45 $÷÷«4.58 $÷÷«4.25
*Reclassified to conform with 2001 presentation.
The average number of common shares outstanding assuming
dilution was lower by 40.9 million shares in 2001 versus
2000 and 59.0 million shares in 2000 versus 1999, primarily as
a result of the company’s common share repurchase program.
The average number of common shares outstanding assum-
ing dilution was 1,771.2 million, 1,812.1 million and 1,871.1
million, respectively, at December 31, 2001, 2000 and 1999.
Revenue in 2001 totaled $85.9 billion, a decline of 2.9 per-
cent(up 1 percent at constant currency) compared with
revenue of $88.4 billion in the year-earlier period. Global
Services and Software revenue grew year over year, but was
more than offset by lower Hardware, Global Financing and
Enterprise Investments/Other revenue.
The Global Services segment became the largest segment
in terms of revenue in 2001. The following table identifies
the company’s percentage of revenue:
2001 2000 1999
Global Services 40.7% 37.5% 36.7%
Hardware 38.9 42.7 43.3
Software 15.1 14.3 14.5
Global Financing 4.0 3.9 3.6
Enterprise Investments/Other 1.3 1.6 1.9
Total 100.0% 100.0% 100.0%
The overall gross profit margin of 37.0 percent increased
0.7 points from 2000, following a 0.3 point increase in 2000
versus 1999. The increase in 2001 gross profit margin was
primarily driven by improvement in Global Services,
Software and Global Financing margins, partially offset by a
lower Hardware gross profit margin. The increase in the
2000 gross profit margin was primarily driven by improvement
in the Hardware margin, partially offset by a lower Global
Services margin. The reference to constant currency, the
best measure of comparative business growth, is made so that
a segment can be viewed without the impacts of changing
foreign currency exchange rates. The U.S. dollar generally
strengthened against other currencies, so growth at constant
currency exchange rates is higher than growth at actual
currency exchange rates.
In the Americas, full-year 2001 revenue was $37.4 billion,
down 3.4 percent (2 percent at constant currency) from the
2000 period. Revenue from Europe/Middle East/Africa was
$24.0 billion, a decrease of 0.9 percent (up 3 percent at con-
stant currency). Asia Pacific revenue declined 2.5 percent (up
8 percent at constant currency) to $17.2 billion. OEM rev-
enue decreased 7.2 percent (6 percent at constant currency)
to $7.2 billion.
Information about the company’s operating segments can
be found in note v, “Segment Information,” on pages 100
through 105. Note v provides additional information, includ-
ing a description of the products and services of each segment,
as well as financial data pertaining to each segment.
The following discussion is based on the Consolidated
Financial Statements on pages 70 through 74, which reflect,
in all material respects, the company’s segment results on an
external basis.
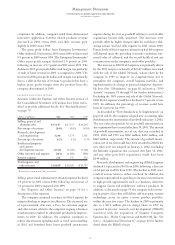
GLOBAL SERVICES
(dollars in millions) 2001 2000 1999
Revenue $«34,956 $«33,152 $«32,172
Cost 25,355 24,309 23,304
Gross profit $«««9,601 $«««8,843 $«««8,868
Gross profit margin 27.5% 26.7% 27.6%
Global Services revenue increased 5.4 percent (10 percent at
constant currency) in 2001 over 2000 and 3.0 percent (6 per-
cent at constant currency) in 2000 over 1999. Global Services
revenue, excluding maintenance, increased 6.8 percent
(11 percent at constant currency) in 2001 versus 2000 and
3.7 percent (7 percent at constant currency) in 2000 versus
1999. Maintenance revenue declined 2.2 percent (up 2 per-
cent at constant currency) in 2001 versus 2000 and was
essentially flat (up 4 percent at constant currency) in 2000
when compared to 1999.
Global Services experienced a slowdown in contract sign-
ings in the middle of the year, particularly in short-term
engagements, which affected the growth of Global Services
revenue in 2001. Strategic Outsourcing Services and
Integrated Technology Services contributed significantly to
the revenue growth in 2001 and 2000. Strategic Outsourcing
Services continued to demonstrate solid revenue growth,