IBM 2001 Annual Report Download - page 65
Download and view the complete annual report
Please find page 65 of the 2001 IBM annual report below. You can navigate through the pages in the report by either clicking on the pages listed below, or by using the keyword search tool below to find specific information within the annual report.-
 1
1 -
2
-
3
-
4
-
5
-
6
-
7
-
8
-
9
-
10
-
11
-
12
-
13
-
14
-
15
-
16
-
17
-
18
-
19
-
20
-
21
-
22
-
23
-
24
-
25
-
26
-
27
-
28
-
29
-
30
-
31
-
32
-
33
-
34
-
35
-
36
-
37
-
38
-
39
-
40
-
41
-
42
-
43
-
44
-
45
-
46
-
47
-
48
-
49
-
50
-
51
-
52
-
53
-
54
-
 55
55 -
 56
56 -
 57
57 -
 58
58 -
 59
59 -
 60
60 -
 61
61 -
 62
62 -
 63
63 -
 64
64 -
 65
65 -
 66
66 -
 67
67 -
 68
68 -
 69
69 -
 70
70 -
 71
71 -
 72
72 -
 73
73 -
 74
74 -
 75
75 -
76
-
77
-
78
-
79
-
80
-
81
-
82
-
83
-
84
-
85
-
86
-
87
-
88
-
89
-
90
-
91
-
92
-
93
-
94
-
95
-
96
-
97
-
98
-
99
-
100
-
101
-
102
-
103
-
104
-
105
-
106
-
107
-
108
-
109
-
110
-
111
-
112
 |
 |

to provide the capacity to meet their obligations to current
and future retirees.
The largest retirement-related benefit plan is the U.S.
Personal Pension Plan (PPP). See page 96 for the impact
that the PPP had on the company’s Income before income
taxes. The following is a discussion of the impacts of recent
changes relating to the PPP on the company’s financial
results. Refer to page 98 for a table containing the actuarial
assumption changes.
The following is the historical actual average rates of
return on plan assets in the PPP:
2001 2000 1999 1998 1997
Actual annualized
rates of return:
15-year average 10.3% «11.9% ««13.5% «12.8% 13.0%
10-year average 10.0% 12.5% 12.3% 12.7% 12.4%
Expected rate
of return
assumptions 10.0% «10.0% «9.5% 9.5% 9.5%
The company uses long-term historical actual return experi-
ence, the expected investment mix of the plans’ assets, and
future estimates of long-term investment returns to develop
its expected rate of return assumption used in the net periodic
pension calculation. This assumption is reviewed and set
annually at the beginning of each year. Accordingly, the
change for 2000 and the decision to leave the rate unchanged
in 2001 was made at the beginning of each respective year. At
the beginning of 2002, using the process described above, the
company reduced its expected long-term return on the U.S.
plan asset assumption from 10.0 percent to 9.5 percent. This
change and the impact of 2002 changes in the expected long-
term rate of return on plan assets for certain non-U.S. plans
is expected to reduce 2002 net retirement plan income by
approximately $350 million. The change in expected long-
term return on U.S. plan assets in 2000 resulted in an
additional $195 million of net retirement plan income for
the year ended December 31, 2000.
The company annually sets its discount rate assumption
for retirement-related benefits accounting to reflect the rates
available on high-quality, fixed-income debt instruments.
Using this process, the company changed its discount rate
assumption for the PPP from 7.25 percent to 7.0 percent,
effective December 31, 2001. This change is not expected to
have a material effect on the company’s 2002 results of oper-
ations. The change in the discount rate from 7.75 percent to
7.25 percent, effective December 31, 2000, did not have a
significant impact on the company’s results of operations for
the year ended December 31, 2001. Effective January 1,
2001, the company increased pension benefits to certain
recipients who retired before January 1, 1997. The increases
Management Discussion
INTERNATIONAL BUSINESS MACHINES CORPORATION
and Subsidiary Companies
63
ranged from 2.5 percent to 25 percent, and are based on the
year of retirement and the pension benefit currently being
received. This improvement resulted in an additional cost to
the company of approximately $100 million in 2001.
The change in discount rate assumption for the 2000 U.S.
plan year did not have a significant impact on the company’s
results of operations for the year ended December 31, 2000.
Future effects of pension plans, including the changes
noted above, on the operating results of the company depend
on economic conditions, employee demographics, mortality
rates and investment performance.
See note v, “Segment Information,” on pages 100 through
105 for additional information about the pre-tax income of
each segment, as well as the methodologies employed by the
company to allocate shared expenses to the segments.
PROVISION FOR INCOME TA X E S
The provision for income taxes resulted in an effective tax
rate of 29.5 percent for 2001, compared with the 2000 effec-
tive tax rate of 29.8 percent and a 1999 effective tax rate of
34.4 percent. The 4.6 point decrease in the 2000 rate from
the 1999 rate was primarily the result of the company’s 1999
sale of its Global Network business and various other actions
implemented during 1999. Had it not been for these 1999
actions, the company’s 1999 effective tax rate would have
been 30 percent (essentially flat from 1998 through 2001).
As reflected in the reconciliation of the company’s effective
tax rate in note o, “Taxes,” on pages 90 and 91, the increased
benefit on the company’s tax rate of the foreign tax differential
in 2000 was principally due to the U.S. tax benefit from the
repatriation of profits previously subject to foreign taxes,
partially offset by a less favorable mix of profits arising in
markets with lower effective tax rates.
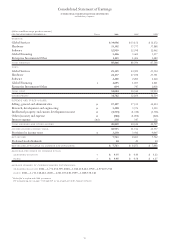
Fourth Quarter
In the quarter ended December 31, 2001, the company had
diluted earnings per common share of $1.33, a 10.1 percent
decrease compared with diluted earnings per common share
of $1.48 in the fourth quarter of 2000. Fourth-quarter 2001
net income was $2.3 billion, a 12.7 percent decrease from
$2.7 billion in the year-earlier period. The company’s fourth
quarter 2001 revenue totaled $22.8 billion, down 10.9 per-
cent (8 percent at constant currency) compared with fourth
quarter of 2000.
In the Americas, fourth-quarter revenue was $9.8 billion,
a decrease of 9.1 percent (8 percent at constant currency)
from the 2000 period. Revenue from Europe/Middle East/
Africa was $6.9 billion, down 6.3 percent (6 percent at constant
currency). Asia Pacific revenue declined 9.8 percent (1 per-
cent at constant currency) to $4.5 billion. OEM revenue