IBM 2001 Annual Report Download - page 102
Download and view the complete annual report
Please find page 102 of the 2001 IBM annual report below. You can navigate through the pages in the report by either clicking on the pages listed below, or by using the keyword search tool below to find specific information within the annual report.-
 1
1 -
2
-
3
-
4
-
5
-
6
-
7
-
8
-
9
-
10
-
11
-
12
-
13
-
14
-
15
-
16
-
17
-
18
-
19
-
20
-
21
-
22
-
23
-
24
-
25
-
26
-
27
-
28
-
29
-
30
-
31
-
32
-
33
-
34
-
35
-
36
-
37
-
38
-
39
-
40
-
41
-
42
-
43
-
44
-
45
-
46
-
47
-
48
-
49
-
50
-
51
-
52
-
53
-
54
-
55
-
56
-
57
-
58
-
59
-
60
-
61
-
62
-
63
-
64
-
65
-
66
-
67
-
68
-
69
-
70
-
71
-
72
-
73
-
74
-
75
-
76
-
77
-
78
-
79
-
80
-
81
-
82
-
83
-
84
-
85
-
86
-
87
-
88
-
89
-
90
-
91
-
 92
92 -
 93
93 -
 94
94 -
 95
95 -
 96
96 -
 97
97 -
 98
98 -
 99
99 -
 100
100 -
 101
101 -
 102
102 -
 103
103 -
 104
104 -
 105
105 -
 106
106 -
 107
107 -
 108
108 -
 109
109 -
 110
110 -
 111
111 -
 112
112
 |
 |

Notes to Consolidated Financial Statements
INTERNATIONAL BUSINESS MACHINES CORPORATION
and Subsidiary Companies
100
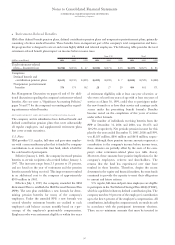
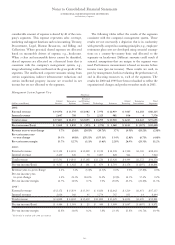
The net periodic postretirement benefit cost for the
U.S. plan for the years ended December 31 include the fol-
lowing components:
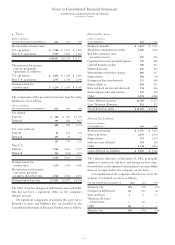
(dollars in millions) 2001 2000 1999
Service cost $«««65 $«««50 $«««48
Interest cost 437 449 424
Expected return on
plan assets —(2) (6)
Amortization of
prior service costs (148) (147) (143)
Recognized actuarial losses 22 24 19
Net periodic post-
retirement benefit cost $«376 $«374 $«342
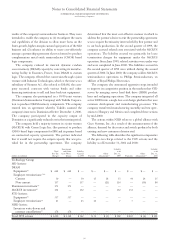
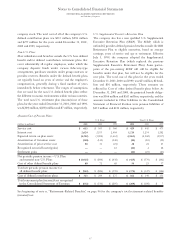
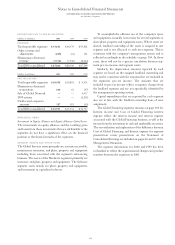
The changes in the benefit obligation and plan assets of the
U.S. plan for 2001 and 2000 are as follows:
(dollars in millions) 2001 2000*
Change in benefit obligation:
Benefit obligation at beginning
of year $««6,443 $««6,178
Service cost 65 50
Interest cost 437 449
Actuarial (gains)/losses (183) 363
Participant contributions 71 23
Benefits paid from trust (68) (110)
Direct benefit payments (617) (510)
Benefit obligation at end of year 6,148 6,443
Change in plan assets:
Fair value of plan assets at
beginning of year 4105
Actual return on plan assets 1(14)
Participant contributions 71 23
Benefits paid (68) (110)
Fair value of plan assets at end of year 84
Benefit obligation in excess
of plan assets (6,140) (6,439)
Unrecognized net actuarial losses 781 986
Unrecognized prior service costs (653) (801)
Accrued postretirement benefit
liability recognized in the
Consolidated Statement
of Financial Position $«(6,012) $«(6,254)
*Reclassified to conform with 2001 presentation.
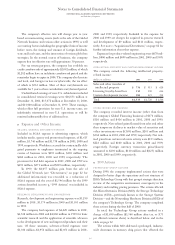
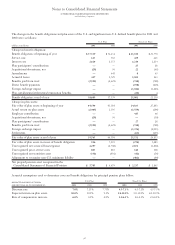
The plan assets primarily comprise short-term fixed-income
investments.
The benefit obligation was determined by applying the
terms of medical, dental and life insurance plans, including
the effects of established maximums on covered costs,
together with relevant actuarial assumptions. These actuarial
assumptions include a projected health care cost trend rate
of 6 percent. The projected health care cost trend rate
assumption is projected to increase to 10 percent in 2002,
and is assumed to decrease gradually to 5 percent by 2007
and remain constant thereafter.
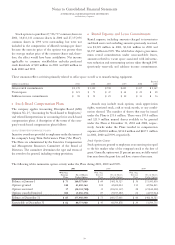
WEIGHTED-AVERAGE ACTUARIAL ASSUMPTIONS
FOR NON-PENSION POSTRETIREMENT
BENEFIT PLANS AS OF DECEMBER 31: 2001 2000 1999
Discount rate 7.00% 7.25% 7.75%
Expected return on
plan assets 5.0% 5.0% 5.0%
The company evaluates its actuarial assumptions on an
annual basis and considers changes in these long-term factors
based upon market conditions and the requirements of SFAS
No. 106, “Employers’ Accounting for Postretirement
Benefits Other Than Pensions.” The discount rate changes
did not have a material effect on net postretirement benefit
cost for the years ended December 31, 2001, 2000 and 1999.
The health care cost trend rate has an insignificant effect
on plan costs and obligations. A one-percentage-point
change in the assumed health care cost trend rate would have
the following effects at December 31, 2001:
One-Percentage- One-Percentage-
(dollars in millions) Point Increase Point Decrease
Effect on total service and
interest cost $«««6 $«««(6)
Effect on postretirement
benefit obligation $«24 $«(29)
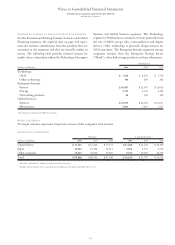
vSegment Information
IBM uses advanced I/T to provide customer solutions. The
company operates primarily in a single industry using several
segments that create value by offering a variety of solutions
that include, either singularly or in some combination, tech-
nologies, systems, products, services, software and financing.
Organizationally, the company’s major operations comprise
a Global Services segment; three hardware product segments
—
Enterprise Systems, Personal and Printing Systems, and
Technology; a Software segment; a Global Financing segment;
and an Enterprise Investments segment. The segments are
determined based on several factors, including customer base,
homogeneity of products, technology and delivery channels.
The Global Services segment is the world’s largest I/T
services provider, supporting computer hardware and soft-
ware products and providing professional services to help
customers of all sizes realize the full value of I/T. The seg-
ment provides value through three primary lines of business:
Strategic Outsourcing Services, BIS and Integrated Technol-
ogy Services. Strategic Outsourcing Services creates
business value through long-term strategic partnerships with