IBM 2001 Annual Report Download - page 107
Download and view the complete annual report
Please find page 107 of the 2001 IBM annual report below. You can navigate through the pages in the report by either clicking on the pages listed below, or by using the keyword search tool below to find specific information within the annual report.-
 1
1 -
2
-
3
-
4
-
5
-
6
-
7
-
8
-
9
-
10
-
11
-
12
-
13
-
14
-
15
-
16
-
17
-
18
-
19
-
20
-
21
-
22
-
23
-
24
-
25
-
26
-
27
-
28
-
29
-
30
-
31
-
32
-
33
-
34
-
35
-
36
-
37
-
38
-
39
-
40
-
41
-
42
-
43
-
44
-
45
-
46
-
47
-
48
-
49
-
50
-
51
-
52
-
53
-
54
-
55
-
56
-
57
-
58
-
59
-
60
-
61
-
62
-
63
-
64
-
65
-
66
-
67
-
68
-
69
-
70
-
71
-
72
-
73
-
74
-
75
-
76
-
77
-
78
-
79
-
80
-
81
-
82
-
83
-
84
-
85
-
86
-
87
-
88
-
89
-
90
-
91
-
92
-
93
-
94
-
95
-
96
-
 97
97 -
 98
98 -
 99
99 -
 100
100 -
 101
101 -
 102
102 -
 103
103 -
 104
104 -
 105
105 -
 106
106 -
 107
107 -
 108
108 -
 109
109 -
 110
110 -
 111
111 -
 112
112
 |
 |

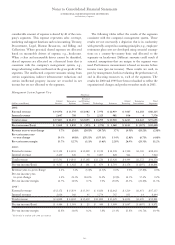
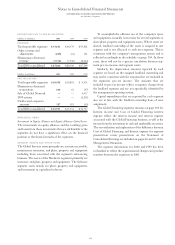
Notes to Consolidated Financial Statements
INTERNATIONAL BUSINESS MACHINES CORPORATION
and Subsidiary Companies
105
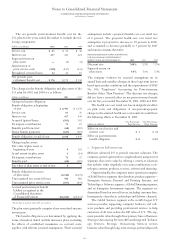
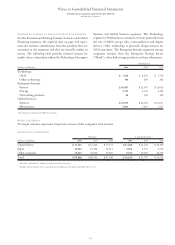
REVENUE BY CLASSES OF SIMILAR PRODUCTS OR SERVICES
For the Personal and Printing Systems, Software and Global
Financing segments, the segment data on page 102 repre-
sents the revenue contributions from the products that are
contained in the segments and that are basically similar in
nature. The following table provides external revenue for
similar classes of products within the Technology, Enterprise
Systems and Global Services segments. The Technology
segment’s OEM hardware comprises revenue primarily from
the sale of HDD storage files, semiconductors and display
devices. Other technology is primarily design services for
OEM customers. The Enterprise Systems segment’s storage
comprises revenue from the Enterprise Storage Server
(“Shark”), other disk storage products and tape subsystems.
Consolidated
(dollars in millions) 2001 2000*1999*
Technology:
OEM $«««7,624 $«««8,229 $«««7,740
Other technology 346 290 286
Enterprise Systems:
Servers $«10,947 $«11,497 $«11,024
Storage 2,755 2,539 2,381
Networking products 41 158 429
Global Services:
Services $«29,953 $«28,036 $«27,035
Maintenance 5,003 5,116 5,137
*Reclassified to conform with 2001 presentation.
MAJOR CUSTOMERS
No single customer represents 10 percent or more of the company’s total revenue.
GEOGRAPHIC INFORMATION
Revenue*Long-lived Assets**
(dollars in millions) 2001 2000 1999 2001 2000 1999
United States $«35,215 $«37,216 $«37,171 $«23,028 $«21,449 $«19,309
Japan 11,514 12,128 10,411 4,034 4,319 4,710
Other countries 39,137 39,052 39,966 9,572 10,029 10,259
Total $«85,866 $«88,396 $«87,548 $«36,634 $«35,797 $«34,278
*Revenue is attributed to countries based on location of customer.
** Includes all non current assets except non current financial instruments and deferred tax assets.