IBM 2001 Annual Report Download - page 85
Download and view the complete annual report
Please find page 85 of the 2001 IBM annual report below. You can navigate through the pages in the report by either clicking on the pages listed below, or by using the keyword search tool below to find specific information within the annual report.-
 1
1 -
2
-
3
-
4
-
5
-
6
-
7
-
8
-
9
-
10
-
11
-
12
-
13
-
14
-
15
-
16
-
17
-
18
-
19
-
20
-
21
-
22
-
23
-
24
-
25
-
26
-
27
-
28
-
29
-
30
-
31
-
32
-
33
-
34
-
35
-
36
-
37
-
38
-
39
-
40
-
41
-
42
-
43
-
44
-
45
-
46
-
47
-
48
-
49
-
50
-
51
-
52
-
53
-
54
-
55
-
56
-
57
-
58
-
59
-
60
-
61
-
62
-
63
-
64
-
65
-
66
-
67
-
68
-
69
-
70
-
71
-
72
-
73
-
74
-
 75
75 -
 76
76 -
 77
77 -
 78
78 -
 79
79 -
 80
80 -
 81
81 -
 82
82 -
 83
83 -
 84
84 -
 85
85 -
 86
86 -
 87
87 -
 88
88 -
 89
89 -
 90
90 -
 91
91 -
 92
92 -
 93
93 -
 94
94 -
 95
95 -
96
-
97
-
98
-
99
-
100
-
101
-
102
-
103
-
104
-
105
-
106
-
107
-
108
-
109
-
110
-
111
-
112
 |
 |

Notes to Consolidated Financial Statements
INTERNATIONAL BUSINESS MACHINES CORPORATION
and Subsidiary Companies
83
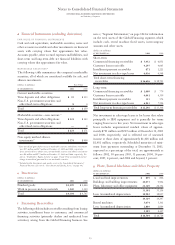
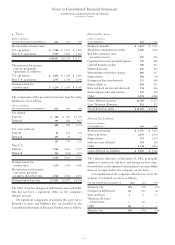
dFinancial Instruments (excluding derivatives)
FAIR VALU E OF FINANCIAL INSTRUMENTS
Cash and cash equivalents, marketable securities, notes and
other accounts receivable and other investments are financial
assets with carrying values that approximate fair value.
Accounts payable, other accrued expenses and liabilities, and
short-term and long-term debt are financial liabilities with
carrying values that approximate fair value.
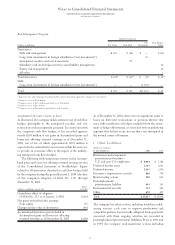
MARKETABLE SECURITIES*
The following table summarizes the company’s marketable
securities, all of which are considered available for sale, and
alliance investments.
(dollars in millions) Fair Value
AT DE CEMBER 31: 2001 2000
Current marketable securities:
Time deposits and other obligations $«««55 $«153
Non-U.S. government securities and
other fixed-term obligations 86
Total $«««63 $«159
Marketable securities
—
non current:**
Time deposits and other obligations $«124 $«163
Non-U.S. government securities and
other fixed-term obligations —8
Total $«124 $«171
Non equity method alliance
investments** $«574 $«909
*Gross unrealized gains (before taxes) on marketable securities and alliance investments
were $27 million and $47 million at December 31, 2001 and 2000, respectively.
Gross unrealized losses (before taxes) on marketable securities and alliance investments
were $4 million and $175 million at December 31, 2001 and 2000, respectively. See
note m, “Stockholders’ Equity Activity,” on pages 88 and 89 for accumulated and net
change in unrealized gains and losses on marketable securities.
** Included within Investments and sundry assets in the Consolidated Statement of
Financial Position. (See note h, “Investments and Sundry Assets,” on page 84.)
eInventories
(dollars in millions)
AT DE CEMBER 31: 2001 2000
Finished goods $«1,259 $«1,446
Work in process and raw materials 3,045 3,319
Total $«4,304 $«4,765
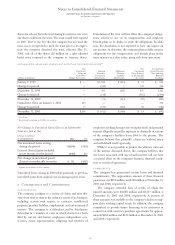
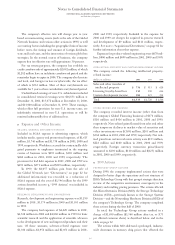
fFinancing Receivables
The following table includes receivables resulting from leasing
activities, installment loans to customers, and commercial
financing activities (primarily dealers and syndicated loan
activities), arising from the Global Financing business. See
note v, “Segment Information,” on page 104 for information
on the total assets of the Global Financing segment, which
include cash, rental machine fixed assets, intercompany
amounts and other assets.
(dollars in millions)
AT DE CEMBER 31: 2001 2000
Short-term:
Commercial financing receivables $«««5,452 $«««6,851
Customer loans receivable 4,297 4,065
Installment payment receivables 871 1,221
Net investment in sales-type leases 6,036 6,568
Total short-term financing
receivables $«16,656 $«18,705
Long-term:
Commercial financing receivables $«««1,009 $««««««779
Customer loans receivable 4,041 4,359
Installment payment receivables 353 574
Net investment in sales-type leases 6,843 7,596
Total long-term financing receivables $«12,246 $«13,308
Net investment in sales-type leases is for leases that relate
principally to IBM equipment and is generally for terms
ranging from two to five years. Net investment in sales-type
leases includes unguaranteed residual values of approxi-
mately $791 million and $785 million at December 31, 2001
and 2000, respectively, and is reflected net of unearned
income at those dates of approximately $1,428 million and
$1,481 million, respectively. Scheduled maturities of mini-
mum lease payments outstanding at December 31, 2001,
expressed as a percentage of the total, are approximately as
follows: 2002, 50 percent; 2003, 31 percent; 2004, 14 per-
cent; 2005, 4 percent; and 2006 and beyond, 1 percent.
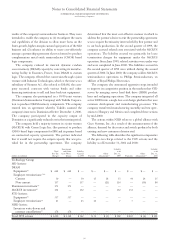
gPlant, Rental Machines and Other Property
(dollars in millions)
AT DE CEMBER 31: 2001 2000
Land and land improvements $««««««859 $««««««896
Buildings and building improvements 10,073 9,904
Plant, laboratory and office equipment 22,369 22,354
33,301 33,154
Less: Accumulated depreciation 18,982 18,857
14,319 14,297
Rental machines 5,074 5,301
Less: Accumulated depreciation 2,889 2,884
2,185 2,417
Total $«16,504 $«16,714