IBM 2001 Annual Report Download - page 67
Download and view the complete annual report
Please find page 67 of the 2001 IBM annual report below. You can navigate through the pages in the report by either clicking on the pages listed below, or by using the keyword search tool below to find specific information within the annual report.-
 1
1 -
2
-
3
-
4
-
5
-
6
-
7
-
8
-
9
-
10
-
11
-
12
-
13
-
14
-
15
-
16
-
17
-
18
-
19
-
20
-
21
-
22
-
23
-
24
-
25
-
26
-
27
-
28
-
29
-
30
-
31
-
32
-
33
-
34
-
35
-
36
-
37
-
38
-
39
-
40
-
41
-
42
-
43
-
44
-
45
-
46
-
47
-
48
-
49
-
50
-
51
-
52
-
53
-
54
-
55
-
56
-
 57
57 -
 58
58 -
 59
59 -
 60
60 -
 61
61 -
 62
62 -
 63
63 -
 64
64 -
 65
65 -
 66
66 -
 67
67 -
 68
68 -
 69
69 -
 70
70 -
 71
71 -
 72
72 -
 73
73 -
 74
74 -
 75
75 -
 76
76 -
 77
77 -
78
-
79
-
80
-
81
-
82
-
83
-
84
-
85
-
86
-
87
-
88
-
89
-
90
-
91
-
92
-
93
-
94
-
95
-
96
-
97
-
98
-
99
-
100
-
101
-
102
-
103
-
104
-
105
-
106
-
107
-
108
-
109
-
110
-
111
-
112
 |
 |

Financing debt, offset by an increase in non-global financing
debt. The decline in Global Financing debt was the result of
the decrease in Global Financing assets.
Effective May 31, 2001, the company arranged global
credit facilities totaling $12.0 billion in committed credit lines,
including an $8.0 billion five-year facility and a $4.0 billion
364-day facility, replacing the company’s $10 billion credit
facility which was due to expire in February 2002. Amounts
unused and available under these facilities were $11,383 mil-
lion and $9,103 million at December 31, 2001 and 2000,
respectively. In addition, at December 31, 2001 and 2000,
the company had in place other lines of credit, most of which
were uncommitted, of $6,860 million and $7,646 million,
respectively. The amounts unused and available under these
primarily uncommitted facilities at December 31, 2001 and
2000, were $4,738 million and $5,111 million, respectively.
At December 31, 2001 and 2000, the company had a total
balance of state and local government loans receivable secu-
ritized of $213 million and $136 million, respectively. For
additional information, see note i, “Sale and Securitization
of Receivables,” on page 84.
The changes in the company’s U.S. pension plan during
2001, including the increased benefits for retirees and the
1999 amendment to the plan, are not expected to have a
material effect on the company’s financial condition.
The major rating agencies’ ratings of the company’s debt
securities at December 31, 2001, appear in the table below:
Standard Moody’s
and Investors
Poor’s Service Fitch, Inc.
Senior long-term debt A+ A1 AA-
Commercial paper A-1 Prime-1 F-1+
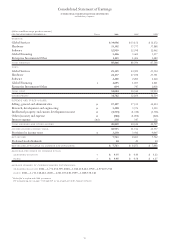
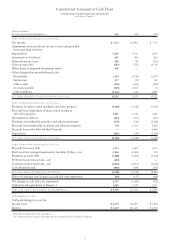
CASH FLOWS
The company’s cash flows from operating, investing and
financing activities, as reflected in the Consolidated State-
ment of Cash Flows on page 74, are summarized in the
following table:
(dollars in millions) 2001 2000 1999
Net cash provided from/
(used in):
Operating activities $«14,265 $««9,274 $«10,111
Investing activities (6,106) (4,248) (1,669)
Financing activities (5,309) (6,359) (8,625)
Effect of exchange rate
changes on cash and
cash equivalents (83) (147) (149)
Net change in cash and
cash equivalents $÷«2,767 $«(1,480) $«««««(332)
WORKING CAPITAL
(dollars in millions)
AT D E C EMBER 31: 2001 2000
Current assets $«42,461 $«43,880
Current liabilities 35,119 36,406
Working capital $÷«7,342 $«««7,474
Current ratio 1.21:1 1.21:1
Current assets decreased $1,419 million due primarily to
decreases in accounts receivable of $3,708 million, Inventories
of $461 million and Deferred taxes of $299 million, offset by
net increases of $2,671 million in Cash and cash equivalents
and current Marketable securities, and $378 million in
Prepaid expenses and other current assets. The decline in
accounts receivable was primarily attributable to lower
fourth quarter 2001 revenue volumes as compared to the
fourth quarter of 2000. The net increase in Cash and cash
equivalents and current Marketable securities was due pri-
marily to an increase in cash from operations and a reduction
in common stock transactions, mainly from lower stock
repurchases, partially offset by an increase in investment and
acquisition activities.
The company ended 2001 with Inventories of $4,304 mil-
lion, the lowest level since 1983, primarily as a result of lower
inventory levels within the Personal and Printing Systems
segment. The company’s inventory turnover ratio declined
to 5.8 in 2001 from 6.3 in 2000.
Current liabilities declined $1,287 million from year-end
2000, primarily due to decreases of $1,145 million in Accounts
payable, $644 million in Other accrued expenses and liabilities
and $293 million in Deferred income, offset by an increase
of $983 million in Short-term debt.
INVESTMENTS
The company’s investments for Plant, rental machines and
other property were $5,660 million for 2001, remaining
essentially flat.
In addition to software development expenses included
in RD&E expense, the company capitalized $655 million of
software costs during 2001, an increase of $90 million
from the 2000 period. The increase resulted from increases
in capitalized costs for both internal-use software and
licensed programs.
Investments and sundry assets were $17,102 million at
the end of 2001, an increase of $2,655 million from 2000,
primarily the result of increases in Prepaid pension assets
and Informix goodwill, offset by declines in Alliance invest-
ments and Deferred taxes. See note h, “Investments and
Sundry Assets,” on page 84 for additional information.
Management Discussion
INTERNATIONAL BUSINESS MACHINES CORPORATION
and Subsidiary Companies
65