IBM 2001 Annual Report Download - page 60
Download and view the complete annual report
Please find page 60 of the 2001 IBM annual report below. You can navigate through the pages in the report by either clicking on the pages listed below, or by using the keyword search tool below to find specific information within the annual report.-
 1
1 -
2
-
3
-
4
-
5
-
6
-
7
-
8
-
9
-
10
-
11
-
12
-
13
-
14
-
15
-
16
-
17
-
18
-
19
-
20
-
21
-
22
-
23
-
24
-
25
-
26
-
27
-
28
-
29
-
30
-
31
-
32
-
33
-
34
-
35
-
36
-
37
-
38
-
39
-
40
-
41
-
42
-
43
-
44
-
45
-
46
-
47
-
48
-
49
-
 50
50 -
 51
51 -
 52
52 -
 53
53 -
 54
54 -
 55
55 -
 56
56 -
 57
57 -
 58
58 -
 59
59 -
 60
60 -
 61
61 -
 62
62 -
 63
63 -
 64
64 -
 65
65 -
 66
66 -
 67
67 -
 68
68 -
 69
69 -
 70
70 -
71
-
72
-
73
-
74
-
75
-
76
-
77
-
78
-
79
-
80
-
81
-
82
-
83
-
84
-
85
-
86
-
87
-
88
-
89
-
90
-
91
-
92
-
93
-
94
-
95
-
96
-
97
-
98
-
99
-
100
-
101
-
102
-
103
-
104
-
105
-
106
-
107
-
108
-
109
-
110
-
111
-
112
 |
 |

58
particularly in Asia Pacific, and in its Web hosting offerings.
Web hosting is an e-sourcing service that became a $1 billion
business in 2001. Integrated Technology Services grew its
revenue in support of server consolidations, business conti-
nuity services, and its OEM alliances. Global Services
revenue growth in support of non-IBM hardware deployment
continues to moderate due to the slowdown in personal
computer, telecommunications and networking equipment
providers. Business Innovation Services (BIS) revenue grew
but it was affected the most by the current economic environ-
ment. This business includes consulting and systems
integration. Despite a slowdown in the BIS market, especially
in the U.S., customers continued to deploy e-business applica-
tions such as customer relationship management and supply
chain management and to perform e-business integration of
their business processes and multiple applications.
Revenue comparisons in 2000 were adversely affected by
two events: the sale of the Global Network to AT&T in 1999
and the decline in Y2K services activity year over year. After
adjusting for those two factors, Global Services revenue
(excluding maintenance) increased 9 percent in 2000 versus
1999. (See “Divestitures,” on page 82 for additional informa-
tion about the Global Network sale.) In 2000, Integrated
Technology Services revenue was affected by the loss of
revenue due to the sale of the Global Network and BIS was
affected primarily by the decline in Y2K activity. BIS recov-
ered in the second half of 2000 as customers shifted from
mature offerings such as custom systems integration and
Y2K remediation to the company’s e-business offerings. BIS
revenue, exclusive of Y2K and custom systems integration,
experienced strong growth in 2000.
In 2001, the company signed contracts totaling $51 bil-
lion, including 39 contracts in excess of $100 million, six of
which exceeded $1 billion. These transactions contributed to
a services backlog at December 31, 2001, of $102 billion
compared with $85 billion at December 31, 2000. The com-
pany experienced an acceleration in contract signings in the
fourth quarter of 2001 and a strong pipeline of contracts at
December 31, 2001, that should have a positive effect on
Global Services revenue growth in 2002. Also, in 2002, the
annuity-like portions of Global Services, particularly out-
sourcing and maintenance, should mitigate the downturn in
other businesses until the economy recovers. To extend the
benefits of outsourcing, the company is in the forefront of
e-sourcing
—
the delivery of infrastructure, applications and
business processes over the Internet as a service. The company
intends to provide the infrastructure technologies that all
of these service providers will require, as well as to provide
many of the services themselves.
Global Services gross profit dollars increased 8.6 percent
in 2001 compared to 2000 and were essentially flat in 2000
versus 1999. The gross profit margin increased 0.8 points in
2001 versus 2000 and declined 0.9 points in 2000 versus
1999. The increases in both gross profit dollars and gross
profit margin in 2001 were a result of reduced labor and
parts costs across all geographies for maintenance offerings
and cost reductions across all services offerings. The decline
in gross profit margin in 2000 was primarily driven by lower
utilization rates in BIS and Integrated Technology Services
due to rapid hiring and retraining associated with rebalancing
skills toward e-business services. Also contributing to the
decline was a revenue shift to OEM alliances, which have a
lower gross profit margin. These declines were partially offset
by an improvement in the maintenance gross profit margin.
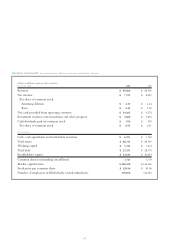
HARDWARE
(dollars in millions) 2001 2000 1999
Revenue $«33,392 $«37,777 $«37,888
Cost 24,137 27,038 27,591
Gross profit $«««9,255 $«10,739 $«10,297
Gross profit margin 27.7% 28.4% 27.2%
Hardware revenue declined 11.6 percent (8 percent at
constant currency) in 2001 versus 2000 and was essentially
flat (up 2 percent at constant currency) in 2000 compared
with 1999.
Effective in the first quarter 2001, the company made
changes in the organization of its Hardware segment. These
changes include the transfer of the xSeries (Intel-based)
servers from the Personal Systems segment to the Enterprise
Systems segment, and the transfer of the Printing Systems
Division from the Technology segment to the newly formed
Personal and Printing Systems segment, consisting of the
realigned Personal Computer Division, Retail Store Solutions
Division and the Printing Systems Division. All amounts
disclosed herein for all years presented have been reclassified
to conform with these changes.
In 2001, Enterprise Systems revenue declined 3.2 percent
from 2000, following an increase of 2.6 percent in 2000 ver-
sus 1999. zSeries revenue grew in 2001, the first full year of
revenue growth since 1989, a clear recognition of the unique
advantages mainframes offer to the company’s customers.
Total deliveries of zSeries computing power increased more
than 30 percent as measured in MIPS (millions of instructions
per second) versus 2000. In addition, revenue growth in stor-
age products was driven by high-end products (“Shark”).
pSeries revenue decreased in 2001 as the market for UNIX-
based servers declined substantially, but the new high-end
Management Discussion
INTERNATIONAL BUSINESS MACHINES CORPORATION
and Subsidiary Companies