IBM 2001 Annual Report Download - page 69
Download and view the complete annual report
Please find page 69 of the 2001 IBM annual report below. You can navigate through the pages in the report by either clicking on the pages listed below, or by using the keyword search tool below to find specific information within the annual report.-
 1
1 -
2
-
3
-
4
-
5
-
6
-
7
-
8
-
9
-
10
-
11
-
12
-
13
-
14
-
15
-
16
-
17
-
18
-
19
-
20
-
21
-
22
-
23
-
24
-
25
-
26
-
27
-
28
-
29
-
30
-
31
-
32
-
33
-
34
-
35
-
36
-
37
-
38
-
39
-
40
-
41
-
42
-
43
-
44
-
45
-
46
-
47
-
48
-
49
-
50
-
51
-
52
-
53
-
54
-
55
-
56
-
57
-
58
-
 59
59 -
 60
60 -
 61
61 -
 62
62 -
 63
63 -
 64
64 -
 65
65 -
 66
66 -
 67
67 -
 68
68 -
 69
69 -
 70
70 -
 71
71 -
 72
72 -
 73
73 -
 74
74 -
 75
75 -
 76
76 -
 77
77 -
 78
78 -
 79
79 -
80
-
81
-
82
-
83
-
84
-
85
-
86
-
87
-
88
-
89
-
90
-
91
-
92
-
93
-
94
-
95
-
96
-
97
-
98
-
99
-
100
-
101
-
102
-
103
-
104
-
105
-
106
-
107
-
108
-
109
-
110
-
111
-
112
 |
 |

Management Discussion
INTERNATIONAL BUSINESS MACHINES CORPORATION
and Subsidiary Companies
67
borrowings that supports such financing revenue is classified in
the Interest expense caption of the Consolidated Statement of
Earnings as opposed to the Cost of Global Financing caption.
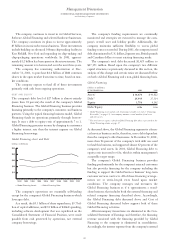
The reconciliation of the segment amounts to the
Consolidated Statement of Earnings amounts for the years
2001, 2000 and 1999 is as follows:
Global Non-Global Consolidated Consolidated
(dollars in millions) Financing Financing Eliminations Results
2001
Cost of Global
Financing $«1,140 $««— $«(176) $««««964
Interest expense —«62 176 «238
2000*
Cost of Global
Financing $«1,319 $««— $«(237) $«1,082
Interest expense —110 «237 347
1999*
Cost of Global
Financing $«1,232 $««— $«(132) $«1,100
Interest expense —220 «132 352
*Reclassified to conform with 2001 presentation.
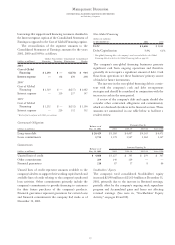
Stockholders’ Equity
The company’s total consolidated Stockholders’ equity
increased $2,990 million to $23,614 million at December 31,
2001, primarily due to the increase in Retained earnings,
partially offset by the company’s ongoing stock repurchase
program and Accumulated gains and losses not affecting
retained earnings. (See note m, “Stockholders’ Equity
Activity,” on pages 88 and 89).
Non-Global Financing
(dollars in millions)
AT DE CEMBER 31: 2001 2000
Debt*$«1,606 $«1,062
Debt/Capitalization 7.5% 6.1%
*Non-global financing debt is the company’s total external debt less the Global
Financing debt described in the Global Financing table on page 66.
The company’s non-global financing businesses generate
significant cash from ongoing operations and therefore
generally do not require a significant amount of debt. Cash
flows from operations are these businesses’ primary source
of funds for future investments.
The increase in the non-global financing debt is consis-
tent with the company’s cash and debt arrangement
strategies and should be considered in conjunction with the
increase in cash in the same period.
A review of the company’s debt and equity should also
consider other contractual obligations and commitments,
which are disclosed elsewhere in the financial section. These
amounts are summarized in one table below to facilitate a
reader’s review.
Contractual Obligations
Balance as of Payments Due In
(dollars in millions) Dec. 31, 2001 2002 2003-04 2005-06 After 2006
Long-term debt $«20,429 $«5,186 $«4,607 $«4,165 $«6,471
Lease commitments 5,734 1,378 1,927 1,062 1,367
Commitments
Balance as of Amounts Expiring In
(dollars in millions) Dec. 31, 2001 2002 2003-04 2005-06 After 2006
Unused lines of credit $«««4,088 $«3,127 $««««395 $««««259 $««««307
Other commitments 269 140 129 — —
Financial guarantees 218 87 37 8 86
Unused lines of credit represent amounts available to the
company’s dealers to support their working capital needs and
available lines of credit relating to the company’s syndicated
loan activities. Other commitments primarily include the
company’s commitments to provide financing to customers
for their future purchases of the company’s products.
Financial guarantees represent guarantees for certain loans
and financial commitments the company had made as of
December 31, 2001.