IBM 2001 Annual Report Download - page 71
Download and view the complete annual report
Please find page 71 of the 2001 IBM annual report below. You can navigate through the pages in the report by either clicking on the pages listed below, or by using the keyword search tool below to find specific information within the annual report.-
 1
1 -
2
-
3
-
4
-
5
-
6
-
7
-
8
-
9
-
10
-
11
-
12
-
13
-
14
-
15
-
16
-
17
-
18
-
19
-
20
-
21
-
22
-
23
-
24
-
25
-
26
-
27
-
28
-
29
-
30
-
31
-
32
-
33
-
34
-
35
-
36
-
37
-
38
-
39
-
40
-
41
-
42
-
43
-
44
-
45
-
46
-
47
-
48
-
49
-
50
-
51
-
52
-
53
-
54
-
55
-
56
-
57
-
58
-
59
-
60
-
 61
61 -
 62
62 -
 63
63 -
 64
64 -
 65
65 -
 66
66 -
 67
67 -
 68
68 -
 69
69 -
 70
70 -
 71
71 -
 72
72 -
 73
73 -
 74
74 -
 75
75 -
 76
76 -
 77
77 -
 78
78 -
 79
79 -
 80
80 -
 81
81 -
82
-
83
-
84
-
85
-
86
-
87
-
88
-
89
-
90
-
91
-
92
-
93
-
94
-
95
-
96
-
97
-
98
-
99
-
100
-
101
-
102
-
103
-
104
-
105
-
106
-
107
-
108
-
109
-
110
-
111
-
112
 |
 |

and China. This growth reflects a new subsidiary in Europe
related to a major services venture with Fiat SpA, and growth
in China to support a rapidly expanding I/T infrastructure.
The company’s complementary workforce is an approxi-
mation of equivalent full-time employees hired under
temporary, part-time and limited-term employment
arrangements to meet specific business needs in a flexible
and cost-effective manner.
Management Discussion
INTERNATIONAL BUSINESS MACHINES CORPORATION
and Subsidiary Companies
69
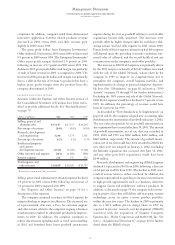
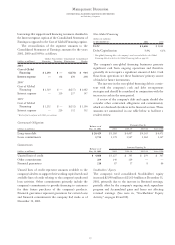
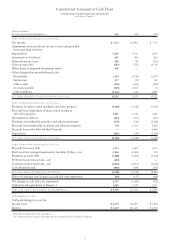
To tal Run-Out of 2001 Balance
2005 and
(dollars in millions) 1999*2000*2001 2002 2003 2004 beyond
Sales-type leases $««««771 $««««785 $÷÷791 $«236 $«273 $«220 $«62
Operating leases 609 396 334 172 95 44 23
Total residual value $«1,380 $«1,181 $«1,125 $«408 $«368 $«264 $«85
*Restated to include residual value associated with non-information technology (I/T) equipment. (Amounts were included in the narrative in prior years.)
instrument portfolio for these theoretical changes in the
level of interest rates are primarily driven by changes in the
company’s debt maturity, interest rate profile and amount. In
2001 versus 2000, the reported increase in interest rate sen-
sitivity is primarily due to reductions in the company’s
“receive fixed/pay floating” interest rate swap portfolio that
had been utilized in 2000 to more closely match the matu-
rity profile of the company’s fixed-rate debt.
Foreign Currency Exchange Rate Risk
At December 31, 2001, a 10 percent weaker U.S. dollar
against foreign currencies with all other variables held con-
stant would result in a decrease in the fair value of the
company’s financial instruments of $1,401 million as com-
pared with a decrease of $1,352 million at December 31,
2000. Conversely, a 10 percent stronger U.S. dollar against
foreign currencies with all other variables held constant
would result in an increase in the fair value of the company’s
financial instruments of $1,440 million compared to $1,435
million at December 31, 2000.
FINANCING RISKS
Financing is an integral part of the company’s total worldwide
offerings. Inherent in financing are certain risks, including
credit, interest rate, currency and residual value. The com-
pany manages credit risk through comprehensive credit
evaluations and pricing practices. To manage the risks associ-
ated with an uncertain interest rate environment, the
company pursues a funding strategy of substantially matching
the interest rate profile of its debt with the interest rate pro-
file of its assets. Currency risks are managed by denominating
liabilities in the same currency as the assets.
Residual value risk is managed by developing projections
of future equipment values at lease inception, reevaluating
these projections quarterly, and effectively deploying remar-
keting capabilities to recover residual values and potentially
earn a profit. The following table presents the recorded
amount of unguaranteed residual values for sales-type and
operating leases at December 31, 1999, 2000 and 2001. In
addition, the table below presents the run-out of the unguar-
anteed residual value over the remaining lives of these leases
at December 31, 2001.
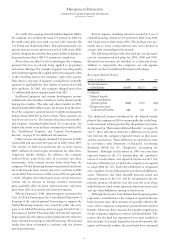
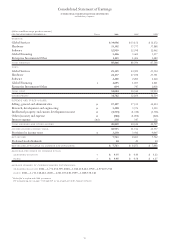
Employees at IBM and its wholly owned subsidiaries in 2001
increased 3,573 from last year. Although the rate of growth
of the company’s workforce slowed in 2001, primarily due to
workforce rebalancing initiatives, the company continued to
hire at a strong pace. Global Services, for example, hired nearly
14,000 people in 2001. Acquisitions, particularly the Informix
database business, added to the 2001 workforce as well.
In less than wholly owned subsidiaries, the number of
employees increased from last year, particularly in Europe
Accounting Estimates
Accounting under generally accepted accounting principles requires the use of estimates. The company’s note a, “Significant
Accounting Policies,” starting on page 75 describes the important estimates used by the company.
Employees and Related Workforce
Percentage Changes
2001 2000 1999 2001-00 2000-99
IBM/wholly owned subsidiaries 319,876 316,303 307,401 1.1 2.9
Less-than-wholly owned subsidiaries 25,403 21,886 17,176 16.1 27.4
Complementary 21,300 25,500 29,800 (16.5) (14.4)