IBM 2001 Annual Report Download - page 104
Download and view the complete annual report
Please find page 104 of the 2001 IBM annual report below. You can navigate through the pages in the report by either clicking on the pages listed below, or by using the keyword search tool below to find specific information within the annual report.-
 1
1 -
2
-
3
-
4
-
5
-
6
-
7
-
8
-
9
-
10
-
11
-
12
-
13
-
14
-
15
-
16
-
17
-
18
-
19
-
20
-
21
-
22
-
23
-
24
-
25
-
26
-
27
-
28
-
29
-
30
-
31
-
32
-
33
-
34
-
35
-
36
-
37
-
38
-
39
-
40
-
41
-
42
-
43
-
44
-
45
-
46
-
47
-
48
-
49
-
50
-
51
-
52
-
53
-
54
-
55
-
56
-
57
-
58
-
59
-
60
-
61
-
62
-
63
-
64
-
65
-
66
-
67
-
68
-
69
-
70
-
71
-
72
-
73
-
74
-
75
-
76
-
77
-
78
-
79
-
80
-
81
-
82
-
83
-
84
-
85
-
86
-
87
-
88
-
89
-
90
-
91
-
92
-
93
-
 94
94 -
 95
95 -
 96
96 -
 97
97 -
 98
98 -
 99
99 -
 100
100 -
 101
101 -
 102
102 -
 103
103 -
 104
104 -
 105
105 -
 106
106 -
 107
107 -
 108
108 -
 109
109 -
 110
110 -
 111
111 -
 112
112
 |
 |

Notes to Consolidated Financial Statements
INTERNATIONAL BUSINESS MACHINES CORPORATION
and Subsidiary Companies
102
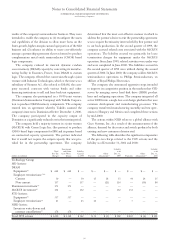
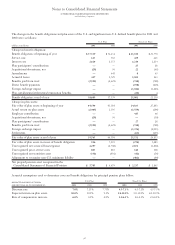
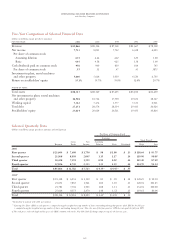
Management System Segment View Hardware
Personal
Global Enterprise and Printing Global Enterprise Total
(dollars in millions) Services Systems Systems Technology Software Financing Investments Segments
2001:
External revenue $«34,956 $«13,743 $«11,982 $«««7,970 $«12,939 $«3,407 $«1,118 $«86,115
Internal revenue 2,647 710 73 2,325 981 836 4 7,576
Total revenue $«37,603 $«14,453 $«12,055 $«10,295 $«13,920 $«4,243 $«1,122 $«93,691
Pre-tax income/(loss) $«««5,161 $÷«1,830 $«««««(153) $«««««(374) $«««3,168 $«1,143 $«««(317) $«10,458
Revenue year-to-year change 5.7% (2.6) % (20.5) % (10.7) % 3.7% (4.5) % (18.2) % (2.8) %
Pre-tax income year-
to-year change 14.3% (4.8) % (251.5) % (155.1) % 13.4% (2.8) % (6.7) % (4.0) %
Pre-tax income margin 13.7% 12.7% (1.3) % (3.6) % 22.8% 26.9% (28.3) % 11.2%
2000*:
External revenue $«33,152 $«14,194 $«15,098 $«««8,519 $«12,598 $«3,500 $«1,369 $«88,430
Internal revenue 2,439 649 70 3,007 828 944 3 7,940
Total revenue $«35,591 $«14,843 $«15,168 $«11,526 $«13,426 $«4,444 $«1,372 $«96,370
Pre-tax income/(loss) $«««4,517 $÷«1,922 $««««««101 $««««««679 $«««2,793 $«1,176 $«««(297) $«10,891
Revenue year-to-year change 2.2% 3.1% (3.0) % (2.3) % 0.0% 9.6% (17.8) % 0.6%
Pre-tax income year-
to-year change 1.2% 21.3% 304.0% 51.2% (9.9) % 12.3% 57.4% 9.2%
Pre-tax income margin 12.7% 12.9% 0.7% 5.9% 20.8% 26.5% (21.6) % 11.3%
1999*:
External revenue $«32,172 $«13,834 $«15,593 $«««8,026 $«12,662 $«3,219 $«1,651 $«87,157
Internal revenue 2,636 568 45 3,774 767 835 19 8,644
Total revenue $«34,808 $«14,402 $«15,638 $«11,800 $«13,429 $«4,054 $«1,670 $«95,801
Pre-tax income/(loss) $«««4,464 $÷«1,584 $««««««««25 $««««««449 $«««3,099 $«1,047 $«««(697) $«««9,971
Pre-tax income margin 12.8% 11.0% 0.2% 3.8% 23.1% 25.8% (41.7) % 10.4%
*Reclassified to conform with 2001 presentation.
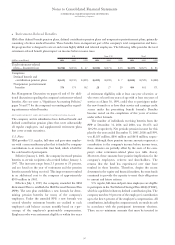
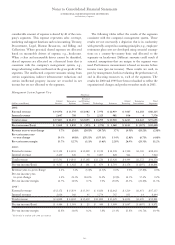
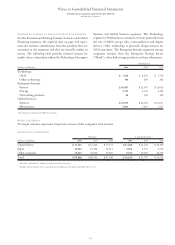
considerable amount of expense is shared by all of the com-
pany’s segments. This expense represents sales coverage,
marketing and support functions such as Accounting, Treasury,
Procurement, Legal, Human Resources, and Billing and
Collections. Where practical, shared expenses are allocated
based on measurable drivers of expense, e.g., headcount.
When a clear and measurable driver cannot be identified,
shared expenses are allocated on a financial basis that is
consistent with the company’s management system; e.g.,
image advertising is allocated based on the gross profit of the
segments. The unallocated corporate amounts arising from
certain acquisitions, indirect infrastructure reductions and
certain intellectual property income are recorded in net
income but are not allocated to the segments.
The following tables reflect the results of the segments
consistent with the company’s management system. These
results are not necessarily a depiction that is in conformity
with generally accepted accounting principles; e.g., employee
retirement plan costs are developed using actuarial assump-
tions on a country-by-country basis and allocated to the
segments on headcount. Different amounts could result if
actuarial assumptions that are unique to the segment were
used. Performance measurement is based on income before
income taxes (pre-tax income). These results are used, in
part, by management, both in evaluating the performance of,
and in allocating resources to, each of the segments. The
results for 2000 and 1999 have been reclassified to reflect the
organizational changes and product transfers made in 2001.