IBM 2001 Annual Report Download - page 8
Download and view the complete annual report
Please find page 8 of the 2001 IBM annual report below. You can navigate through the pages in the report by either clicking on the pages listed below, or by using the keyword search tool below to find specific information within the annual report.-
 1
1 -
 2
2 -
 3
3 -
 4
4 -
 5
5 -
 6
6 -
 7
7 -
 8
8 -
 9
9 -
 10
10 -
 11
11 -
 12
12 -
 13
13 -
 14
14 -
 15
15 -
 16
16 -
 17
17 -
 18
18 -
 19
19 -
20
-
21
-
22
-
23
-
24
-
25
-
26
-
27
-
28
-
29
-
30
-
31
-
32
-
33
-
34
-
35
-
36
-
37
-
38
-
39
-
40
-
41
-
42
-
43
-
44
-
45
-
46
-
47
-
48
-
49
-
50
-
51
-
52
-
53
-
54
-
55
-
56
-
57
-
58
-
59
-
60
-
61
-
62
-
63
-
64
-
65
-
66
-
67
-
68
-
69
-
70
-
71
-
72
-
73
-
74
-
75
-
76
-
77
-
78
-
79
-
80
-
81
-
82
-
83
-
84
-
85
-
86
-
87
-
88
-
89
-
90
-
91
-
92
-
93
-
94
-
95
-
96
-
97
-
98
-
99
-
100
-
101
-
102
-
103
-
104
-
105
-
106
-
107
-
108
-
109
-
110
-
111
-
112
 |
 |
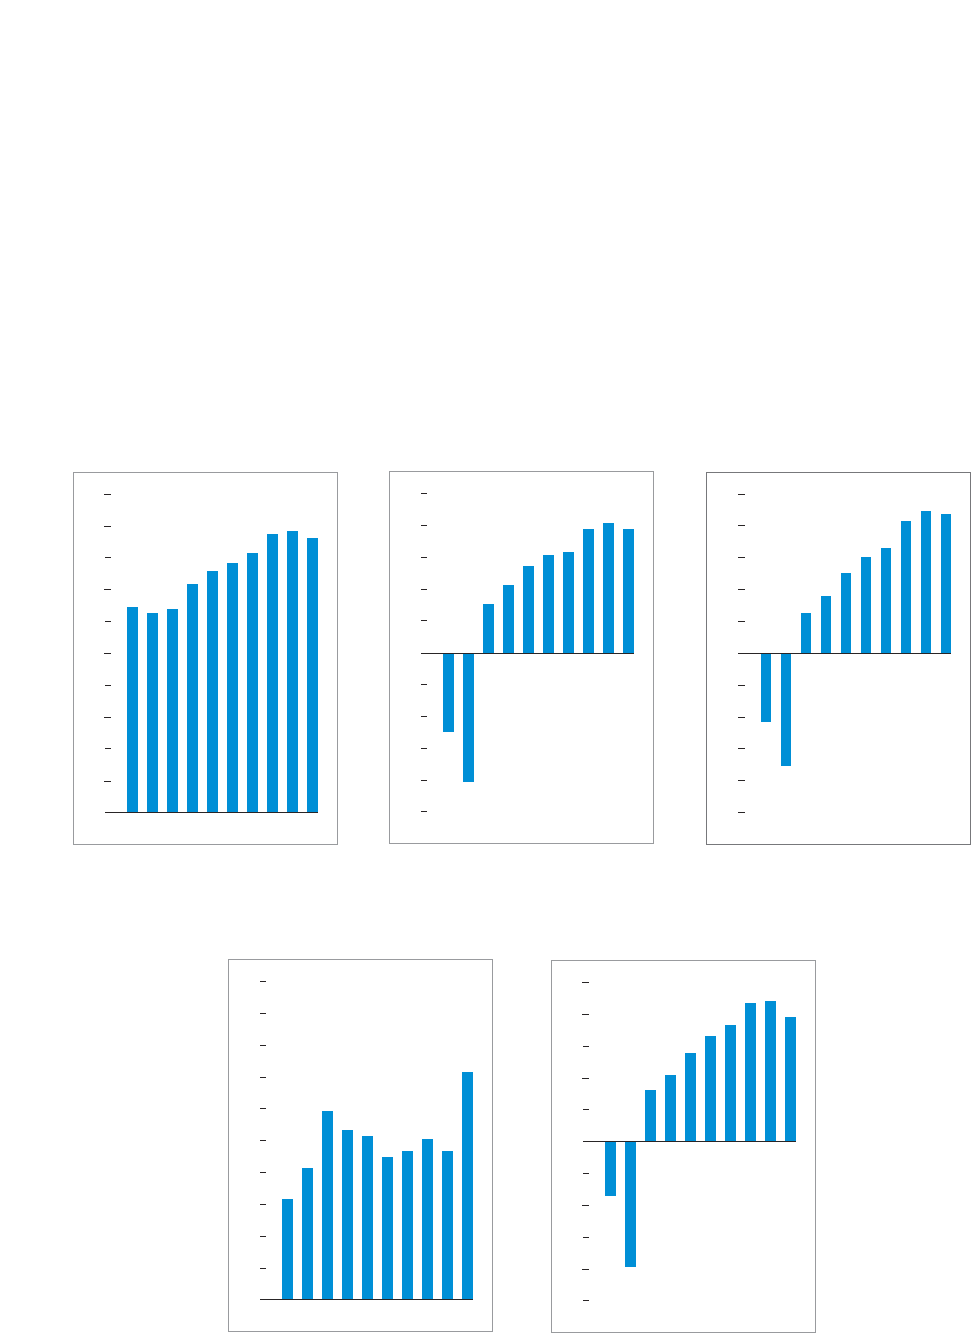
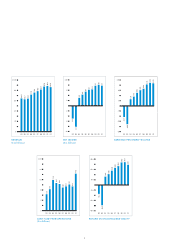
CASH FLOW FROM OPERATIONS
($in billions)
EARNINGS PER SHARE —DILUTED
REVENUE
($in billions)
RETURN ON STOCKHOLDERS’ EQUITY
NET INCOME
($in billions)
6.3
8.3
10.3
8.9
9.3
10.1
9.3
14.3
11.8
10.7
92 93 94 95 96 97 98 99 00 01
0
4
8
12
16
$ 20
-2.17
-3.55
2.50
3.00
3.29
4.12
4.44
4.35
1.24
1.76
92 93 94 95 96 97 98 99 00 01
-5
-3
-1
1
3
$ 5
64.5
62.7
75.9
78.5
81.7
87.5
88.4
85.9
64.1
71.9
92 93 94 95 96 97 98 99 00 01
0
20
40
60
80
$
100
24.8
29.7
32.6
39.0
39.7
35.1
14.3
-15.4
-35.2
18.5
92 93 94 95 96 97 98 99 00 01
-45%
-27%
-9%
9%
27%
45%
-5.0
-8.1
5.4
6.1
6.3
7. 7
8.1
7. 7
3.0
4.2
92 93 94 95 96 97 98 99 00 01
-10
-6
-2
2
6
$
10
6