IBM 2001 Annual Report Download - page 68
Download and view the complete annual report
Please find page 68 of the 2001 IBM annual report below. You can navigate through the pages in the report by either clicking on the pages listed below, or by using the keyword search tool below to find specific information within the annual report.-
 1
1 -
2
-
3
-
4
-
5
-
6
-
7
-
8
-
9
-
10
-
11
-
12
-
13
-
14
-
15
-
16
-
17
-
18
-
19
-
20
-
21
-
22
-
23
-
24
-
25
-
26
-
27
-
28
-
29
-
30
-
31
-
32
-
33
-
34
-
35
-
36
-
37
-
38
-
39
-
40
-
41
-
42
-
43
-
44
-
45
-
46
-
47
-
48
-
49
-
50
-
51
-
52
-
53
-
54
-
55
-
56
-
57
-
 58
58 -
 59
59 -
 60
60 -
 61
61 -
 62
62 -
 63
63 -
 64
64 -
 65
65 -
 66
66 -
 67
67 -
 68
68 -
 69
69 -
 70
70 -
 71
71 -
 72
72 -
 73
73 -
 74
74 -
 75
75 -
 76
76 -
 77
77 -
 78
78 -
79
-
80
-
81
-
82
-
83
-
84
-
85
-
86
-
87
-
88
-
89
-
90
-
91
-
92
-
93
-
94
-
95
-
96
-
97
-
98
-
99
-
100
-
101
-
102
-
103
-
104
-
105
-
106
-
107
-
108
-
109
-
110
-
111
-
112
 |
 |

Management Discussion
INTERNATIONAL BUSINESS MACHINES CORPORATION
and Subsidiary Companies
66
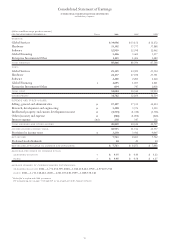
The company continues to invest in its Global Services,
Software, Global Financing and selected hardware businesses.
The company continues its plans to invest approximately
$5 billion in its microelectronics business. These investments
include building an advanced 300mm chip-making facility in
East Fishkill, New York and expanding its chip-making and
chip-packaging operations worldwide. In 2001, approxi-
mately $1.2 billion has been spent on these investments. The
remaining amount is to be invested over the next three years.
The company has remaining authorization at Dec-
ember 31, 2001, to purchase $4.6 billion of IBM common
shares in the open market from time to time, based on mar-
ket conditions.
The company expects to fund all of these investments
primarily with cash from ongoing operations.
DEBT AND EQUITY
The company’s debt level of $27 billion is almost entirely
(more than 94 percent) the result of the company’s Global
Financing business. The Global Financing business provides
financing primarily to the company’s customers and business
partners. Using the typical financing business model, Global
Financing funds its operations primarily through borrow-
ings. It uses a debt to equity ratio of approximately 7 to 1.
Global Financing generates income by charging its customers
a higher interest rate than the interest expense on Global
Financing borrowings.
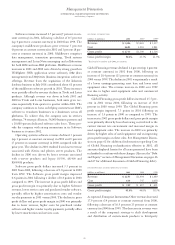
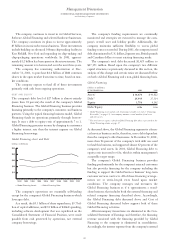
Global Financing Assets and Debt
(dollars in billions)
nGlobal Financing Assets nGlobal Financing Debt
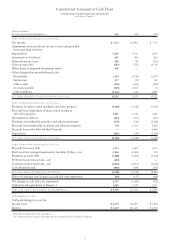
The company’s operations are essentially self-funding
except for the company’s Global Financing business which
leverages debt.
As a result, the $5.3 billion of share repurchases, $5.7 bil-
lion of capital additions, and $5.8 billion of RD&E spending,
including software development that was capitalized on the
Consolidated Statement of Financial Position, were made
possible from cash generated by operations, not external
company borrowings.
The company’s funding requirements are continually
monitored and strategies are executed to manage the com-
pany’s overall asset and liability profile. Additionally, the
company maintains sufficient flexibility to access global
funding sources as needed. During 2001, the company issued
debt denominated in U.S. dollars, Japanese yen, British pounds
and Canadian dollars to meet existing financing needs.
The company’s total debt decreased $1,425 million to
$27,151 million. Based upon the company’s two different
capital structures as previously discussed in this section, the
analysis of this change and certain ratios are discussed below
on both a Global Financing and a non-global financing basis.
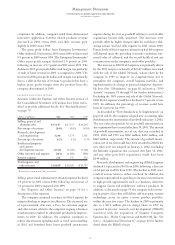
Global Financing
(dollars in millions)
AT DE CEMBER 31: 2001 2000
Assets*$«36,670 $«40,822
Debt** 25,545 27,514
Equity ÷«3,756 «««4,142
Debt/Equity 6.8x 6.6x
*Global Financing assets include cash, financing receivables (see note f, “Financing
Receivables,” on page 83), intercompany amounts, rental machine fixed assets
and other assets.
** The total interest expense related to Global Financing debt above is presented in the
Global Financing column on page 67.
As discussed above, the Global Financing segment is a finan-
cial services business and is, therefore, more debt dependent
than the company’s other businesses. At December 31, 2001,
more than 94 percent of the company’s total debt was used
to fund this business, and supported almost 42 percent of the
company’s total assets. In 2001, Global Financing debt to
equity ratio increased to 6.8x, which is within management’s
acceptable target range.
The company’s Global Financing business provides
funding predominantly for the company’s external customers
but also provides financing for the company including the
funding to support the Global Services business’ long-term
customer services contracts. All of these financing arrange-
ments are at arm’s-length rates based upon market
conditions. The company manages and measures the
Global Financing business as if it approximates a stand-
alone business that includes both the external financing and
related company financing described above. Accordingly,
the Global Financing debt discussed above and Cost of
Global Financing discussed below support both of these
Global Financing activities.
All intercompany transactions are eliminated in the Con-
solidated Statement of Earnings and therefore, the financing
revenue associated with the financing provided by Global
Financing to the company is eliminated in consolidation.
Accordingly, the interest expense from the company’s external
1992 1993 1994 1995 1996 1997 1998 1999 2000 2001
$10
$20
$30
$40
$50