IBM 2001 Annual Report Download - page 86
Download and view the complete annual report
Please find page 86 of the 2001 IBM annual report below. You can navigate through the pages in the report by either clicking on the pages listed below, or by using the keyword search tool below to find specific information within the annual report.-
 1
1 -
2
-
3
-
4
-
5
-
6
-
7
-
8
-
9
-
10
-
11
-
12
-
13
-
14
-
15
-
16
-
17
-
18
-
19
-
20
-
21
-
22
-
23
-
24
-
25
-
26
-
27
-
28
-
29
-
30
-
31
-
32
-
33
-
34
-
35
-
36
-
37
-
38
-
39
-
40
-
41
-
42
-
43
-
44
-
45
-
46
-
47
-
48
-
49
-
50
-
51
-
52
-
53
-
54
-
55
-
56
-
57
-
58
-
59
-
60
-
61
-
62
-
63
-
64
-
65
-
66
-
67
-
68
-
69
-
70
-
71
-
72
-
73
-
74
-
75
-
 76
76 -
 77
77 -
 78
78 -
 79
79 -
 80
80 -
 81
81 -
 82
82 -
 83
83 -
 84
84 -
 85
85 -
 86
86 -
 87
87 -
 88
88 -
 89
89 -
 90
90 -
 91
91 -
 92
92 -
 93
93 -
 94
94 -
 95
95 -
 96
96 -
97
-
98
-
99
-
100
-
101
-
102
-
103
-
104
-
105
-
106
-
107
-
108
-
109
-
110
-
111
-
112
 |
 |

Notes to Consolidated Financial Statements
INTERNATIONAL BUSINESS MACHINES CORPORATION
and Subsidiary Companies
84
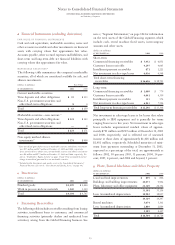
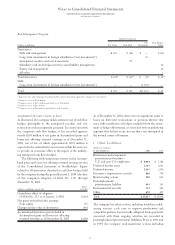
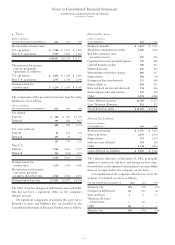
hInvestments and Sundry Assets
(dollars in millions)
AT DE CEMBER 31: 2001 2000
Deferred taxes $«««2,395 $«««2,968
Prepaid pension assets 9,407 6,806
Alliance investments:
Equity method 544 629
Other 574 909
Goodwill (less accum. amortization) 1,278 848
Marketable securities
—
non current 124 171
Software 963 782
Other assets 1,817 1,334
Total $«17,102 $«14,447
iSale and Securitization of Receivables
The company periodically sells receivables through the
securitization of loans, leases and trade receivables. The
company retains servicing rights in the securitized receiv-
ables for which it receives a servicing fee. Any gain or loss
incurred as a result of such sales is recognized in the period
in which the sale occurs.
During 2001, the company entered into an uncommitted
trade receivables securitization facility that allows for the
ongoing sale of up to $500 million of trade receivables. This
facility was put in place primarily to provide backup liquid-
ity and can be accessed on three days’ notice. The company
sold $179 million in trade receivables through this facility in
2001. In addition, the company sold $278 million of loans
receivable due from state and local government customers
through a securitization program established in 1990. No
receivables were sold in 2000 under this program. Net gains
and losses on these sales were insignificant.
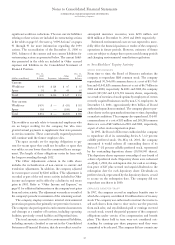
Total cash proceeds of $460 million were received in
2001 from the sale and securitization of receivables.
At December 31, 2001, the total balance of assets securi-
tized and under the company’s management was $213 million,
all of which related to loans receivable. Servicing assets net
of servicing liabilities were insignificant.
The investors in the loans receivable securitizations have
recourse to the company via a limited guarantee. At year-end
2001, delinquent amounts from the receivables sold and net
credit losses were insignificant.
jBorrowings
SHORT-TERM DEBT
(dollars in millions)
AT DE CEMBER 31: 2001 2000
Commercial paper $«««4,809 $«««3,521
Short-term loans 1,564 3,975
Long-term debt: Current maturities 4,815 2,709
Total $«11,188 $«10,205
The weighted-average interest rates for commercial paper at
December 31, 2001 and 2000, were 1.9 percent and 6.7 per-
cent, respectively. The weighted-average interest rates for
short-term loans at December 31, 2001 and 2000, were 4.0
percent and 2.9 percent, respectively.
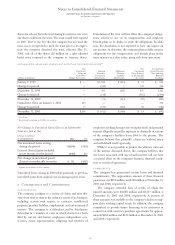
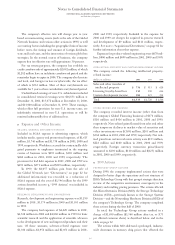
LONG-TERM DEBT
(dollars in millions)
AT DE CEMBER 31: Maturities 2001 2000
U.S. dollars:
Debentures:
6.22% 2027 $««««««500 $««««««500
6.5% 2028 700 700
7.0% 2025 600 600
7.0% 2045 150 150
7.125% 2096 850 850
7.5% 2013 550 550
8.375% 2019 750 750
Notes: 6.3% average 2002-2014 2,772 2,933
Medium-term note
program: 5.4% average 2002-2014 3,620 4,305
Other: 4.5% average 2002-2009 828 1,092
11,320 12,430
Other currencies
(average interest rate
at December 31, 2001,
in parentheses):
Euros (4.4%) 2002-2009 3,042 3,042
Japanese yen (1.1%) 2002-2014 4,749 4,845
Canadian dollars (5.8%) 2002-2011 441 302
Swiss francs (4.0%) 2002-2003 151 231
Other (6.1%) 2002-2014 726 275
20,429 21,125
Less: Net unamortized
discount 47 45
Add: SFAS No. 133 fair
value adjustment*396 —
20,778 21,080
Less: Current maturities 4,815 2,709
Total $«15,963 $«18,371
*In accordance with the requirements of SFAS No. 133, the portion of the company’s
fixed-rate debt obligations that is hedged is reflected in the Consolidated Statement
of Financial Position as an amount equal to the sum of the debt’s carrying value plus
a SFAS No. 133 fair value adjustment representing changes recorded in the fair value
of the hedged debt obligations attributable to movements in market interest rates.