IBM 2001 Annual Report Download - page 108
Download and view the complete annual report
Please find page 108 of the 2001 IBM annual report below. You can navigate through the pages in the report by either clicking on the pages listed below, or by using the keyword search tool below to find specific information within the annual report.-
 1
1 -
2
-
3
-
4
-
5
-
6
-
7
-
8
-
9
-
10
-
11
-
12
-
13
-
14
-
15
-
16
-
17
-
18
-
19
-
20
-
21
-
22
-
23
-
24
-
25
-
26
-
27
-
28
-
29
-
30
-
31
-
32
-
33
-
34
-
35
-
36
-
37
-
38
-
39
-
40
-
41
-
42
-
43
-
44
-
45
-
46
-
47
-
48
-
49
-
50
-
51
-
52
-
53
-
54
-
55
-
56
-
57
-
58
-
59
-
60
-
61
-
62
-
63
-
64
-
65
-
66
-
67
-
68
-
69
-
70
-
71
-
72
-
73
-
74
-
75
-
76
-
77
-
78
-
79
-
80
-
81
-
82
-
83
-
84
-
85
-
86
-
87
-
88
-
89
-
90
-
91
-
92
-
93
-
94
-
95
-
96
-
97
-
 98
98 -
 99
99 -
 100
100 -
 101
101 -
 102
102 -
 103
103 -
 104
104 -
 105
105 -
 106
106 -
 107
107 -
 108
108 -
 109
109 -
 110
110 -
 111
111 -
 112
112
 |
 |

106
INTERNATIONAL BUSINESS MACHINES CORPORATION
and Subsidiary Companies
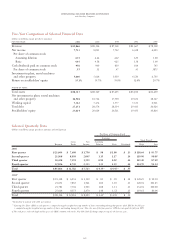
Five-Year Comparison of Selected Financial Data
(dollars in millions except per share amounts)
FOR THE YEAR: 2001 2000 1999 1998 1997
Revenue $«85,866 $«88,396 $«87,548 $«81,667 $«78,508
Net income 7,723 8,093 7,712 6,328 6,093
Per share of common stock:
Assuming dilution 4.35 4.44 4.12 3.29 3.00
Basic 4.45 4.58 4.25 3.38 3.09
Cash dividends paid on common stock 956 909 859 814 763
Per share of common stock .55 .51 .47 .43 .3875
Investment in plant, rental machines
and other property 5,660 5,616 5,959 6,520 6,793
Return on stockholders’ equity 35.1% 39.7% 39.0% 32.6% 29.7%
AT END OF YEAR:
Total assets $«88,313 $«88,349 $«87,495 $«86,100 $«81,499
Net investment in plant, rental machines
and other property 16,504 16,714 17,590 19,631 18,347
Working capital 7,342 7,474 3,577 5,533 6,911
Total debt 27,151 28,576 28,354 29,413 26,926
Stockholders’ equity 23,614 20,624 20,511 19,433 19,816
Selected Quarterly Data
(dollars in millions except per share amounts and stock prices)
Per Share of Common Stock
Earnings
Gross Net Assuming Stock Prices†
Revenue Profit Income Dilution Basic Dividends High Low
2001
First quarter $«21,044 $«««7,608 $«1,750 $«««.98 $«1.00 $«««.13 $«118.64 $««83.75
Second quarter 21,568 8,038 2,045 1.15 1.17 .14 119.90 90.05
Third quarter 20,428 7,391 1,595 0.90 0.92 .14 115.40 87.49
Fourth quarter 22,826 8,745 2,333 1.33 1.35 .14 124.70 91.34
Tota l $«85,866 $«31,782 $«7,723 $«4.35** $«4.45** $«««.55
2000*
First quarter $«19,348 $«««6,934 $«1,519 $«««.83 $«««.85 $«««.12 $«128.25 $««99.50
Second quarter 21,651 7,863 1,941 1.06 1.10 .13 126.94 101.25
Third quarter 21,781 7,704 1,963 1.08 1.11 .13 134.94 100.00
Fourth quarter 25,616 9,553 2,670 1.48 1.52 .13 119.63 80.06
Total $«88,396 $«32,054 $«8,093 $«4.44*$«4.58 $«««.51
*Reclassified to conform with 2001 presentation.
** Earnings Per Share (EPS) in each quarter is computed using the weighted-average number of shares outstanding during that quarter while EPS for the full year
is computed using the weighted-average number of shares outstanding during the year. Thus, the sum of the four quarters’ EPS does not equal the full-year EPS.
†The stock prices reflect the high and low prices for IBM’s common stock on the New York Stock Exchange composite tape for the last two years.