IBM 2001 Annual Report Download - page 100
Download and view the complete annual report
Please find page 100 of the 2001 IBM annual report below. You can navigate through the pages in the report by either clicking on the pages listed below, or by using the keyword search tool below to find specific information within the annual report.-
 1
1 -
2
-
3
-
4
-
5
-
6
-
7
-
8
-
9
-
10
-
11
-
12
-
13
-
14
-
15
-
16
-
17
-
18
-
19
-
20
-
21
-
22
-
23
-
24
-
25
-
26
-
27
-
28
-
29
-
30
-
31
-
32
-
33
-
34
-
35
-
36
-
37
-
38
-
39
-
40
-
41
-
42
-
43
-
44
-
45
-
46
-
47
-
48
-
49
-
50
-
51
-
52
-
53
-
54
-
55
-
56
-
57
-
58
-
59
-
60
-
61
-
62
-
63
-
64
-
65
-
66
-
67
-
68
-
69
-
70
-
71
-
72
-
73
-
74
-
75
-
76
-
77
-
78
-
79
-
80
-
81
-
82
-
83
-
84
-
85
-
86
-
87
-
88
-
89
-
 90
90 -
 91
91 -
 92
92 -
 93
93 -
 94
94 -
 95
95 -
 96
96 -
 97
97 -
 98
98 -
 99
99 -
 100
100 -
 101
101 -
 102
102 -
 103
103 -
 104
104 -
 105
105 -
 106
106 -
 107
107 -
 108
108 -
 109
109 -
 110
110 -
111
-
112
 |
 |

Notes to Consolidated Financial Statements
INTERNATIONAL BUSINESS MACHINES CORPORATION
and Subsidiary Companies
98
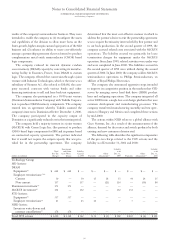
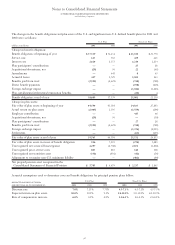
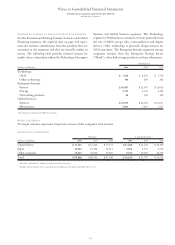
The changes in the benefit obligations and plan assets of the U.S. and significant non-U.S. defined benefit plans for 2001 and
2000 were as follows:
U.S. Plan Non-U.S. Plans
(dollars in millions) 2001 2000 2001 2000
Change in benefit obligation:
Benefit obligation at beginning of year $«37,539 $«34,434 $«21,150 $«21,770
Service cost 613 563 429 445
Interest cost 2,624 2,553 1,214 1,234
Plan participants’ contributions ——27 28
Acquisitions/divestitures, net (29) 36 22 (65)
Amendments —645 863
Actuarial losses 457 1,729 1,101 243
Benefits paid from trust (2,595) (2,421) (748) (728)
Direct benefit payments ——(198) (218)
Foreign exchange impact ——(1,184) (1,626)
Plan curtailments/settlements/termination benefits ——(20) 4
Benefit obligation at end of year 38,609 37,539 21,801 21,150
Change in plan assets:
Fair value of plan assets at beginning of year 44,594 45,584 24,833 27,843
Actual return on plan assets (2,405) 1,395 (1,559) (196)
Employer contribution ——417 66
Acquisitions/divestitures, net (29) 36 —(50)
Plan participants’ contributions ——27 28
Benefits paid from trust (2,595) (2,421) (748) (728)
Foreign exchange impact ——(1,376) (2,015)
Settlements ——(63) (115)
Fair value of plan assets at end of year 39,565 44,594 21,531 24,833
Fair value of plan assets in excess of benefit obligation 956 7,055 (270) 3,683
Unrecognized net actuarial losses/(gains) 4,297 (2,768) 2,871 (1,860)
Unrecognized prior service costs 803 883 140 168
Unrecognized net transition asset (351) (491) (42) (56)
Adjustment to recognize non-U.S. minimum liability ——(462) (90)
Net prepaid pension asset recognized in the
Consolidated Statement of Financial Position $«««5,705 $«««4,679 $«««2,237 $«««1,845
Actuarial assumptions used to determine costs and benefit obligations for principal pension plans follow:
WEIGHTED-AVERAGE ACTUARIAL U.S. Plan Non-U.S. Plans
ASSUMPTIONS AS OF DECEMBER 31: 2001 2000 1999 2001 2000 1999
Discount rate 7.0% 7.25% 7.75% 4.5-7.1% 4.5-7.1% 4.5-7.3%
Expected return on plan assets 10.0% 10.0% 9.5% 5.0-10.0% 5.0-11.0% 6.0-10.5%
Rate of compensation increase 6.0% 6.0% 6.0% 2.0-6.1% 2.6-6.1% 2.6-6.1%