IBM 2001 Annual Report Download - page 93
Download and view the complete annual report
Please find page 93 of the 2001 IBM annual report below. You can navigate through the pages in the report by either clicking on the pages listed below, or by using the keyword search tool below to find specific information within the annual report.-
 1
1 -
2
-
3
-
4
-
5
-
6
-
7
-
8
-
9
-
10
-
11
-
12
-
13
-
14
-
15
-
16
-
17
-
18
-
19
-
20
-
21
-
22
-
23
-
24
-
25
-
26
-
27
-
28
-
29
-
30
-
31
-
32
-
33
-
34
-
35
-
36
-
37
-
38
-
39
-
40
-
41
-
42
-
43
-
44
-
45
-
46
-
47
-
48
-
49
-
50
-
51
-
52
-
53
-
54
-
55
-
56
-
57
-
58
-
59
-
60
-
61
-
62
-
63
-
64
-
65
-
66
-
67
-
68
-
69
-
70
-
71
-
72
-
73
-
74
-
75
-
76
-
77
-
78
-
79
-
80
-
81
-
82
-
 83
83 -
 84
84 -
 85
85 -
 86
86 -
 87
87 -
 88
88 -
 89
89 -
 90
90 -
 91
91 -
 92
92 -
 93
93 -
 94
94 -
 95
95 -
 96
96 -
 97
97 -
 98
98 -
 99
99 -
 100
100 -
 101
101 -
 102
102 -
 103
103 -
104
-
105
-
106
-
107
-
108
-
109
-
110
-
111
-
112
 |
 |

2000 and 1999, respectively. Included in the expense for
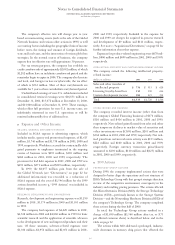
2000 and 1999 are charges for acquired in-process research
and development of $9 million and $111 million, respec-
tively. See note c,“Acquisitions/Divestitures,” on page 82 for
further information about that expense.
Expenses for product-related engineering were $670 mil-
lion, $806 million and $699 million in 2001, 2000 and 1999,
respectively.
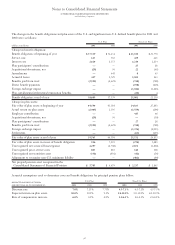
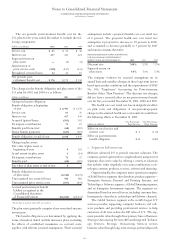
INTELLECTUAL PROPERTY AND CUSTOM DEVELOPMENT INCOME
The company earned the following intellectual property-
related income:
(dollars in millions) 2001 2000 1999
Sales and other transfers of
intellectual property $««««736 $««««915 $««««628
Licensing/royalty-based fees 515 590 646
Custom development income 284 223 232
Total $«1,535 $«1,728 $«1,506
OTH ER INCOME AND EXPENSE
The company recorded interest income (other than from
the company’s Global Financing business) of $178 million,
$310 million and $416 million in 2001, 2000 and 1999,
respectively. Net realized gains/(losses) from sales and other
than temporary declines in market value of securities and
other investments were $(169) million, $265 million and
$366 million in 2001, 2000 and 1999, respectively. Net real-
ized gains from certain real estate activity were $133 million,
$222 million and $100 million in 2001, 2000 and 1999,
respectively. Foreign currency transaction gains/(losses)
amounted to $198 million, $140 million and $(125) million
in 2001, 2000 and 1999, respectively.
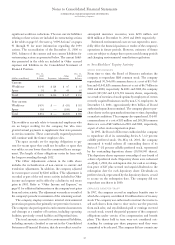
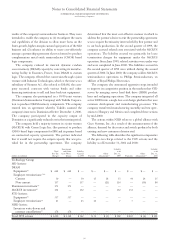
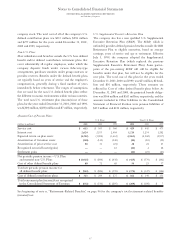
q1999 Actions
TECHNOLOGY GROUP ACTIONS
During 1999, the company implemented actions that were
designed to better align the operations and cost structure of
IBM’s Technology Group with that group’s strategic direction
in view of the competitive environment, overcapacity in the
industry and resulting pricing pressures. The actions affected
the Microelectronics Division (MD), the Storage Technology
Division (STD)
—
previously known as the Storage Systems
Division
—
and the Networking Hardware Division (NHD) of
the company’s Technology Group. The company completed
these actions during the first half of 2000.
In total, the Technology Group actions resulted in a
charge of $1,690 million ($1,366 million after tax, or $.73
per diluted common share) as described below and in the
table on page 92.
The actions within MD addressed a prolonged, industry-
wide downturn in memory chip prices that affected the
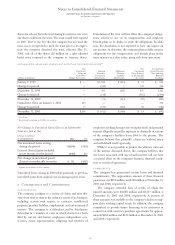
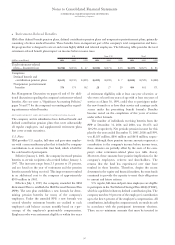
The company’s effective rate will change year to year
based on nonrecurring events (such as the sale of the Global
Network business and various other actions in 1999) as well
as recurring factors including the geographical mix of income
before taxes, the timing and amount of foreign dividends,
state and local taxes, and the interaction of various global tax
strategies. In the normal course of business, the company
expects that its effective rate will approximate 30 percent.
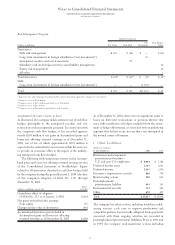
For tax return purposes, the company has available tax
credit carryforwards of approximately $2,092 million, of which
$1,282 million have an indefinite carryforward period and the
remainder begin to expire in 2004. The company also has state
and local, and foreign tax loss carryforwards, the tax effect
of which is $563 million. Most of these carryforwards are
available for 5 years or have an indefinite carryforward period.
Undistributed earnings of non-U.S. subsidiaries included
in consolidated retained earnings were $16,851 million at
December 31, 2001, $15,472 million at December 31, 2000,
and $14,900 million at December 31, 1999. These earnings,
which reflect full provision for non-U.S. income taxes, are
indefinitely reinvested in non-U.S. operations or will be
remitted substantially free of additional tax.
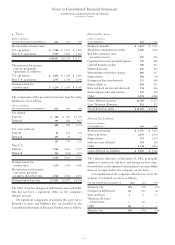
pExpense and Other Income
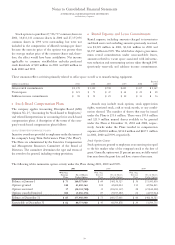
SELLING, GENERAL AND ADMINISTRATIVE
Included in SG&A expense is advertising expense, which
includes media, agency and promotional expenses, of $1,615
million, $1,746 million and $1,758 million in 2001, 2000 and
1999, respectively. Workforce accruals for contractually obli-
gated payments to employees terminated in the ongoing
course of business were $293 million, $169 million and
$486 million in 2001, 2000 and 1999, respectively. The
provision for bad debt expense in 2001, 2000 and 1999 was
$491 million, $271 million and $319 million, respectively.
In 1999, the $4,057 million gain from the sale of
the Global Network (see “Divestitures,” on page 82 for
additional information) was recorded as a reduction of
SG&A expense and the cost of $1,546 million for the 1999
actions described in note q, “1999 Actions,” was included in
SG&A expense.
RESEARCH, DEVELOPMENT AND ENGINEERING
Research, development and engineering expense was $5,290
million in 2001, $5,374 million in 2000 and $5,505 million
in 1999.
The company had expenses of $4,620 million in 2001,
$4,568 million in 2000 and $4,806 million in 1999 for basic
scientific research and the application of scientific advances
to the development of new and improved products and their
uses. Of these amounts, software-related expenses were
$1,926 million, $1,956 million and $2,051 million in 2001,
Notes to Consolidated Financial Statements
INTERNATIONAL BUSINESS MACHINES CORPORATION
and Subsidiary Companies
91