IBM 2001 Annual Report Download - page 72
Download and view the complete annual report
Please find page 72 of the 2001 IBM annual report below. You can navigate through the pages in the report by either clicking on the pages listed below, or by using the keyword search tool below to find specific information within the annual report.-
 1
1 -
2
-
3
-
4
-
5
-
6
-
7
-
8
-
9
-
10
-
11
-
12
-
13
-
14
-
15
-
16
-
17
-
18
-
19
-
20
-
21
-
22
-
23
-
24
-
25
-
26
-
27
-
28
-
29
-
30
-
31
-
32
-
33
-
34
-
35
-
36
-
37
-
38
-
39
-
40
-
41
-
42
-
43
-
44
-
45
-
46
-
47
-
48
-
49
-
50
-
51
-
52
-
53
-
54
-
55
-
56
-
57
-
58
-
59
-
60
-
61
-
 62
62 -
 63
63 -
 64
64 -
 65
65 -
 66
66 -
 67
67 -
 68
68 -
 69
69 -
 70
70 -
 71
71 -
 72
72 -
 73
73 -
 74
74 -
 75
75 -
 76
76 -
 77
77 -
 78
78 -
 79
79 -
 80
80 -
 81
81 -
 82
82 -
83
-
84
-
85
-
86
-
87
-
88
-
89
-
90
-
91
-
92
-
93
-
94
-
95
-
96
-
97
-
98
-
99
-
100
-
101
-
102
-
103
-
104
-
105
-
106
-
107
-
108
-
109
-
110
-
111
-
112
 |
 |

70
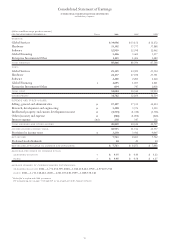
Consolidated Statement of Earnings
INTERNATIONAL BUSINESS MACHINES CORPORATION
and Subsidiary Companies
(dollars in millions except per share amounts)
FOR THE YEAR ENDED DECEMBER 31: Notes 2001 2000*1999*
REVENUE:
Global Services $«34,956 $«33,152 $«32,172
Hardware 33,392 37,777 37,888
Software 12,939 12,598 12,662
Global Financing 3,426 3,465 3,137
Enterprise Investments/Other 1,153 1,404 1,689
TOTAL REVENUE 85,866 88,396 87,548
COST:
Global Services 25,355 24,309 23,304
Hardware 24,137 27,038 27,591
Software 2,265 2,283 2,240
Global Financing j1,693 1,965 1,821
Enterprise Investments/Other 634 747 1,038
TOTAL COST 54,084 56,342 55,994
GROSS PROFIT 31,782 32,054 31,554
EXPENSE AND OTHER INCOME:
Selling, general and administrative p17,197 17,535 16,294
Research, development and engineering p5,290 5,374 5,505
Intellectual property and custom development income p(1,535) (1,728) (1,506)
Other (income) and expense p(361) (1,008) (848)
Interest expense j & k 238 347 352
TOTAL EXPENSE AND OTHER INCOME 20,829 20,520 19,797
INCOME BEFORE INCOME TAXES 10,953 11,534 11,757
Provision for income taxes o3,230 3,441 4,045
NET INCOME 7,723 8,093 7,712
Preferred stock dividends 10 20 20
NET INCOME APPLICABLE TO COMMON STOCKHOLDERS $«««7,713 $«««8,073 $÷«7,692
EARNINGS PER SHARE OF COMMON STOCK:
ASSUMING DILUTION r$«««««4.35 $««÷«4.44 $«÷««4.12
BASIC r$«««««4.45 $«÷««4.58 $«÷««4.25
AVE RAGE NUMBER OF COMMON SHARES OUTSTANDING:
ASSUMING DILUTION: 2001
—
1,771,230,599; 2000
—
1,812,118,422; 1999
—
1,871,073,912
BASIC: 2001
—
1,733,348,422; 2000
—
1,763,037,049; 1999
—
1,808,538,346
*Reclassified to conform with 2001 presentation.
The accompanying notes on pages 75 through 105 are an integral part of the financial statements.