IBM 2001 Annual Report Download - page 92
Download and view the complete annual report
Please find page 92 of the 2001 IBM annual report below. You can navigate through the pages in the report by either clicking on the pages listed below, or by using the keyword search tool below to find specific information within the annual report.-
 1
1 -
2
-
3
-
4
-
5
-
6
-
7
-
8
-
9
-
10
-
11
-
12
-
13
-
14
-
15
-
16
-
17
-
18
-
19
-
20
-
21
-
22
-
23
-
24
-
25
-
26
-
27
-
28
-
29
-
30
-
31
-
32
-
33
-
34
-
35
-
36
-
37
-
38
-
39
-
40
-
41
-
42
-
43
-
44
-
45
-
46
-
47
-
48
-
49
-
50
-
51
-
52
-
53
-
54
-
55
-
56
-
57
-
58
-
59
-
60
-
61
-
62
-
63
-
64
-
65
-
66
-
67
-
68
-
69
-
70
-
71
-
72
-
73
-
74
-
75
-
76
-
77
-
78
-
79
-
80
-
81
-
 82
82 -
 83
83 -
 84
84 -
 85
85 -
 86
86 -
 87
87 -
 88
88 -
 89
89 -
 90
90 -
 91
91 -
 92
92 -
 93
93 -
 94
94 -
 95
95 -
 96
96 -
 97
97 -
 98
98 -
 99
99 -
 100
100 -
 101
101 -
 102
102 -
103
-
104
-
105
-
106
-
107
-
108
-
109
-
110
-
111
-
112
 |
 |

Notes to Consolidated Financial Statements
INTERNATIONAL BUSINESS MACHINES CORPORATION
and Subsidiary Companies
90
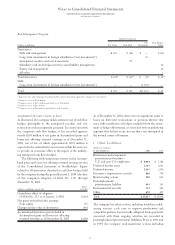
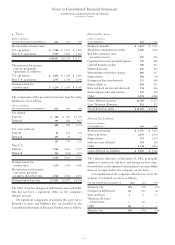
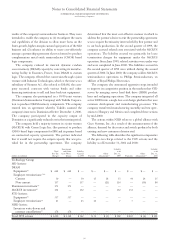
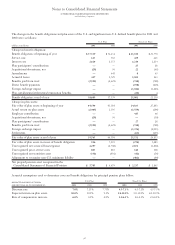
oTaxes
(dollars in millions)
FOR THE YEAR ENDED DECEMBER 31: 2001 2000 1999
Income before income taxes:
U.S. operations $«««5,386 $«««5,871 $«««5,892
Non-U.S. operations 5,567 5,663 5,865
$«10,953 $«11,534 $«11,757
The provision for income
taxes by geographic
operations is as follows:
U.S. operations $«««1,455 $«««1,692 $«««2,005
Non-U.S. operations 1,775 1,749 2,040
Total provision for
income taxes $«««3,230 $«««3,441 $«««4,045
The components of the provision for income taxes by taxing
jurisdiction are as follows:
(dollars in millions)
FOR THE YEAR ENDED DECEMBER 31: 2001 2000 1999
U.S. federal:
Current $««««348 $««««613 $«1,759
Deferred 341 286 (427)
689 899 1,332
U.S. state and local:
Current 62 192 272
Deferred 155 47 7
217 239 279
Non-U.S.:
Current 2,162 2,607 2,727
Deferred 162 (304) (293)
2,324 2,303 2,434
Total provision for
income taxes 3,230 3,441 4,045
Provision for social security,
real estate, personal
property and other taxes 2,761 2,766 2,831
Total provision for taxes $«5,991 $«6,207 $«6,876
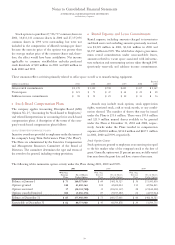
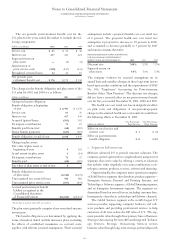
The effect of tax law changes on deferred tax assets and liabil-
ities did not have a significant effect on the company’s
effective tax rate.
The significant components of activities that gave rise to
deferred tax assets and liabilities that are recorded on the
Consolidated Statement of Financial Position were as follows:
Deferred Tax Assets
(dollars in millions)
AT DE CEMBER 31: 2001 2000
Employee benefits $«««3,612 $«««3,673
Alternative minimum tax credits 1,282 1,424
Bad debt, inventory and
warranty reserves 907 953
Capitalized research and development 747 848
General business credits 700 655
Deferred income 656 837
Infrastructure reduction charges 466 617
Depreciation 386 376
Foreign tax loss carryforwards 325 489
Equity alliances 290 437
State and local tax loss carryforwards 238 246
Intracompany sales and services 127 149
Other 2,974 2,809
Gross deferred tax assets 12,710 13,513
Less: Valuation allowance 581 572
Net deferred tax assets $«12,129 $«12,941
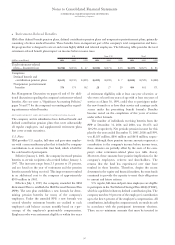
Deferred Tax Liabilities
(dollars in millions)
AT DE CEMBER 31: 2001 2000
Retirement benefits $«««3,977 $«««3,447
Sales-type leases 2,159 2,450
Depreciation 971 1,179
Software costs deferred 318 306
Other 1,744 1,836
Gross deferred tax liabilities $«««9,169 $«««9,218
The valuation allowance at December 31, 2001, principally
applies to certain state and local, and foreign tax loss carry-
forwards that, in the opinion of management, are more likely
than not to expire before the company can use them.
A reconciliation of the company’s effective tax rate to the
statutory U.S. federal tax rate is as follows:
FOR THE YEAR ENDED DECEMBER 31: 2001 2000 1999
Statutory rate 35% 35% 35%
Foreign tax differential (5) (6) (2)
State and local 111
Valuation allowance
related items —(1) —
Other (1) 1—
Effective rate 30% 30% 34%