IBM 2001 Annual Report Download - page 62
Download and view the complete annual report
Please find page 62 of the 2001 IBM annual report below. You can navigate through the pages in the report by either clicking on the pages listed below, or by using the keyword search tool below to find specific information within the annual report.-
 1
1 -
2
-
3
-
4
-
5
-
6
-
7
-
8
-
9
-
10
-
11
-
12
-
13
-
14
-
15
-
16
-
17
-
18
-
19
-
20
-
21
-
22
-
23
-
24
-
25
-
26
-
27
-
28
-
29
-
30
-
31
-
32
-
33
-
34
-
35
-
36
-
37
-
38
-
39
-
40
-
41
-
42
-
43
-
44
-
45
-
46
-
47
-
48
-
49
-
50
-
51
-
 52
52 -
 53
53 -
 54
54 -
 55
55 -
 56
56 -
 57
57 -
 58
58 -
 59
59 -
 60
60 -
 61
61 -
 62
62 -
 63
63 -
 64
64 -
 65
65 -
 66
66 -
 67
67 -
 68
68 -
 69
69 -
 70
70 -
 71
71 -
 72
72 -
73
-
74
-
75
-
76
-
77
-
78
-
79
-
80
-
81
-
82
-
83
-
84
-
85
-
86
-
87
-
88
-
89
-
90
-
91
-
92
-
93
-
94
-
95
-
96
-
97
-
98
-
99
-
100
-
101
-
102
-
103
-
104
-
105
-
106
-
107
-
108
-
109
-
110
-
111
-
112
 |
 |

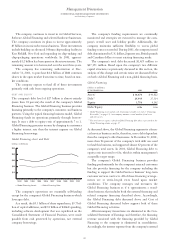
Software revenue increased 2.7 percent (7 percent at con-
stant currency) in 2001, following a decline of 0.5 percent
(up 4 percent at constant currency) in 2000 from 1999. The
company’s middleware products grew revenue 5 percent
(9 percent at constant currency) in 2001 and 3 percent (8 per-
cent at constant currency) in 2000. Middleware comprises
data management, transaction processing, Tivoli systems
management and Lotus Notes messaging and collaboration
for both IBM and non-IBM platforms. Middleware revenue
increases in 2001 and 2000 were driven by strong growth in
WebSphere (Web application server software), DB2 (data
management) and MQSeries (business integration software)
offerings. Revenue from the acquisition of the Informix
database business in July 2001 contributed about 62 percent
of the middleware software growth in 2001. These increases
were partially offset by revenue declines in Tivoli and Lotus
products. Although revenue was down in both 2001 and
2000 in Tivoli and Lotus businesses, both units grew rev-
enue sequentially from quarter to quarter within 2001. The
company continues to focus on helping customers use IBM’s
software to transform businesses to e-businesses across all
platforms. To achieve this, the company uses its services
offerings, 74 strategic alliances, 56,000 business partners and
a 10,000-person dedicated software sales force. These pro-
vide the company with strong momentum in its Software
business as it enters 2002.
Operating systems software revenue declined 3 percent
(up 1 percent at constant currency) in 2001 and 9 percent
(5 percent at constant currency) in 2000 compared with the
prior year. The decline in 2001 resulted from lower revenue
associated with iSeries and pSeries server products. The
decline in 2000 was driven by lower revenue associated
with e-server products and legacy (S/390, AS/400 and
RS/6000) products.
Software gross profit dollars increased 3.5 percent in
2001 from 2000, following a decrease of 1.0 percent in 2000
from 1999. The Software gross profit margin improved
0.6 points in 2001 following a decline of 0.4 points in 2000
compared to 1999. The increase in gross profit dollars and
gross profit margin was primarily due to higher Software
revenue, lower service costs and purchased vendor software,
partially offset by higher amortization costs and vendor
royalty payments in 2001 versus 2000. The decline in gross
profit dollars and gross profit margin in 2000 was primarily
due to lower revenue, higher costs for purchased vendor
software and higher vendor royalty payments, partially offset
by lower amortization and services costs.
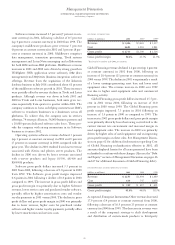
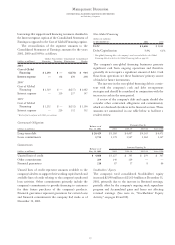
GLOBAL FINANCING
(dollars in millions) 2001 2000*1999*
Revenue $«3,426 $«3,465 $«3,137
Cost 1,693 1,965 1,821
Gross profit $«1,733 $«1,500 $«1,316
Gross profit margin 50.6% 43.3% 41.9%
*Reclassified to conform with 2001 presentation.
Global Financing revenue declined 1.1 percent (up 1 percent
at constant currency) in 2001 from 2000, following an
increase of 10.4 percent (13 percent at constant currency) in
2000 versus 1999. The decline in 2001 was primarily a result
of a lower earnings-generating asset base and lower used
equipment sales. The revenue increase in 2000 over 1999
was due to higher used equipment sales and commercial
financing activity.
Global Financing gross profit dollars increased 15.5 per-
cent in 2001 versus 2000, following an increase of 14.0
percent in 2000 versus 1999. The Global Financing gross
profit margin improved 7.3 points in 2001 following an
increase of 1.4 points in 2000 as compared to 1999. The
increases in 2001 gross profit dollars and gross profit margin
were primarily driven by lower borrowing costs related to the
current interest rate environment and increased margin in
used equipment sales. The increase in 2000 was primarily
driven by higher sales of used equipment and an improving
gross profit margin on these sales. See Management Discus-
sion on page 62 for additional information regarding Cost
of Global Financing reclassification effective in 2001. All
amounts displayed herein for all years presented have been
reclassified to conform with these changes. (Also see the “Debt
and Equity” section of Management Discussion on pages 66
and 67 for additional discussion of Global Financing debt.)
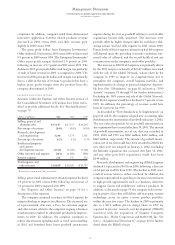
ENTERPRISE INVESTMENTS/OTHER
(dollars in millions) 2001 2000 1999
Revenue $«1,153 $«1,404 $«1,689
Cost 634 747 1,038
Gross profit $««««519 $««««657 $««««651
Gross profit margin 45.0% 46.8% 38.5%
As expected, Enterprise Investments/Other revenue decreased
17.9 percent (14 percent at constant currency) from 2000,
following a decrease of 16.9 percent (13 percent at constant
currency) in 2000 from 1999. The decreases in revenue were
a result of the company’s strategy to shift development
and distribution of custom-made products to third-party
Management Discussion
INTERNATIONAL BUSINESS MACHINES CORPORATION
and Subsidiary Companies
60