IBM 2001 Annual Report Download - page 106
Download and view the complete annual report
Please find page 106 of the 2001 IBM annual report below. You can navigate through the pages in the report by either clicking on the pages listed below, or by using the keyword search tool below to find specific information within the annual report.-
 1
1 -
2
-
3
-
4
-
5
-
6
-
7
-
8
-
9
-
10
-
11
-
12
-
13
-
14
-
15
-
16
-
17
-
18
-
19
-
20
-
21
-
22
-
23
-
24
-
25
-
26
-
27
-
28
-
29
-
30
-
31
-
32
-
33
-
34
-
35
-
36
-
37
-
38
-
39
-
40
-
41
-
42
-
43
-
44
-
45
-
46
-
47
-
48
-
49
-
50
-
51
-
52
-
53
-
54
-
55
-
56
-
57
-
58
-
59
-
60
-
61
-
62
-
63
-
64
-
65
-
66
-
67
-
68
-
69
-
70
-
71
-
72
-
73
-
74
-
75
-
76
-
77
-
78
-
79
-
80
-
81
-
82
-
83
-
84
-
85
-
86
-
87
-
88
-
89
-
90
-
91
-
92
-
93
-
94
-
95
-
 96
96 -
 97
97 -
 98
98 -
 99
99 -
 100
100 -
 101
101 -
 102
102 -
 103
103 -
 104
104 -
 105
105 -
 106
106 -
 107
107 -
 108
108 -
 109
109 -
 110
110 -
 111
111 -
 112
112
 |
 |

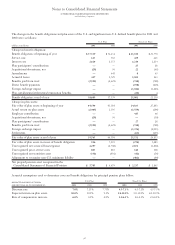
Notes to Consolidated Financial Statements
INTERNATIONAL BUSINESS MACHINES CORPORATION
and Subsidiary Companies
104
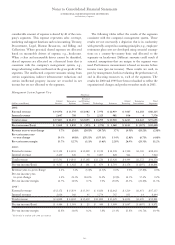
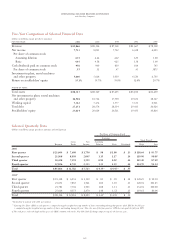
Management System Segment View Hardware
Personal
Global Enterprise and Printing Global Enterprise Total
(dollars in millions) Services Systems Systems Technology Software Financing Investments Segments
2001:
Assets $«10,340 $«3,208 $«1,904 $«9,136 $«3,356 $«36,670 $«106 $«64,720
Depreciation/amortization 1,219 308 131 1,105 782 2,476 8 6,029
Capital expenditures/
investment in software 1,519 390 128 1,855 839 3,143 7 7,881
Interest income —————2,941—2,941
Cost of Global Financing
interest expense —————1,140—1,140
2000*:
Assets $««10,492 $«3,451 $«2,448 $«9,316 $«2,488 $«40,822 $«246 $«69,263
Depreciation/amortization 1,243 425 154 1,060 665 2,696 12 6,255
Capital expenditures/
investment in software 1,311 325 180 1,744 770 2,898 9 7,237
Interest income —————3,051—3,051
Cost of Global Financing
interest expense —————1,319—1,319
1999*:
Assets $««««9,312 $«3,788 $«1,691 $«9,187 $«2,527 $«39,686 $«369 $«66,560
Depreciation/amortization 1,259 234 149 2,077 576 2,976 15 7,286
Capital expenditures/
investment in software 1,292 363 163 1,792 656 3,217 12 7,495
Interest income —————2,961—2,961
Cost of Global Financing
interest expense —————1,232—1,232
*Reclassified to conform with 2001 presentation.
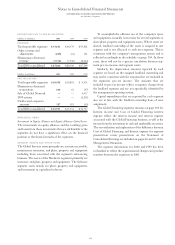
RECONCILIATIONS TO IBM AS REPORTED
(dollars in millions) 2001 2000 1999
Assets:
Total reportable segments $«64,720 $«69,263 $«66,560
Elimination of internal transactions (4,884) (5,300) (5,776)
Unallocated amounts:
Cash and marketable securities 5,313 2,268 4,563
Notes and accounts receivable 2,810 3,145 2,658
Deferred tax assets 4,624 5,498 5,428
Plant, other property
and equipment 3,260 3,798 4,161
Pension assets 9,408 6,809 5,636
Other 3,062 2,868 4,265
Total IBM consolidated $«88,313 $«88,349 $«87,495