Holiday Inn 2008 Annual Report Download - page 83
Download and view the complete annual report
Please find page 83 of the 2008 Holiday Inn annual report below. You can navigate through the pages in the report by either clicking on the pages listed below, or by using the keyword search tool below to find specific information within the annual report.-
 1
1 -
2
-
3
-
4
-
5
-
6
-
7
-
8
-
9
-
10
-
11
-
12
-
13
-
14
-
15
-
16
-
17
-
18
-
19
-
20
-
21
-
22
-
23
-
24
-
25
-
26
-
27
-
28
-
29
-
30
-
31
-
32
-
33
-
34
-
35
-
36
-
37
-
38
-
39
-
40
-
41
-
42
-
43
-
44
-
45
-
46
-
47
-
48
-
49
-
50
-
51
-
52
-
53
-
54
-
55
-
56
-
57
-
58
-
59
-
60
-
61
-
62
-
63
-
64
-
65
-
66
-
67
-
68
-
69
-
70
-
71
-
72
-
 73
73 -
 74
74 -
 75
75 -
 76
76 -
 77
77 -
 78
78 -
 79
79 -
 80
80 -
 81
81 -
 82
82 -
 83
83 -
 84
84 -
 85
85 -
 86
86 -
 87
87 -
 88
88 -
 89
89 -
 90
90 -
 91
91 -
 92
92 -
 93
93 -
94
-
95
-
96
-
97
-
98
-
99
-
100
-
101
-
102
-
103
-
104
-
105
-
106
-
107
-
108
 |
 |

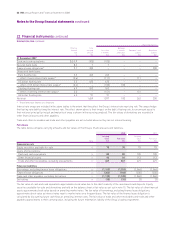
22 Financial instruments
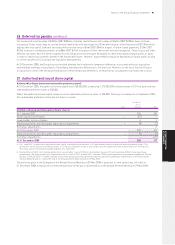
Liquidity risk
The following are the undiscounted contractual cash flows of financial liabilities, including interest payments:
Less than Between 1 and Between 2 and More than
1 year 2 years 5 years 5 years Total
$m $m $m $m $m
31 December 2008
Secured bank loans 28––10
Finance lease obligations 16 16 48 3,380 3,460
Unsecured bank loans 1,156–––1,156
Trade and other payables 737 101 113 277 1,228
Derivatives 643–13
Less than Between 1 and Between 2 and More than
1 year 2 years 5 years 5 years Total
$m $m $m $m $m
31 December 2007
Secured bank loans 2 2 8 – 12
Finance lease obligations 16 16 48 3,396 3,476
Unsecured bank loans 1,570 – – – 1,570
Trade and other payables 781 127 100 110 1,118
Derivatives 12 – – – 12
Cash flows relating to unsecured bank loans are classified according to the maturity date of the loan drawdown rather than the facility
maturity date.
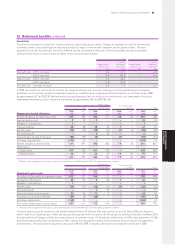
Credit risk
The carrying amount of financial assets represents the maximum exposure to credit risk.
2008 2007
$m $m
Equity securities available-for-sale 70 93
Loans and receivables:
Cash and cash equivalents 82 105
Other financial assets 92 113
Trade and other receivables, excluding prepayments 367 421
611 732
Interest rate risk
For each class of interest-bearing financial asset and financial liability, the following table indicates the range of interest rates effective at
the balance sheet date, the carrying amount on the balance sheet and the periods in which they reprice, if earlier than the maturity date:
Repricing analysis
Effective Total Between Between Between
interest carrying Less than 6 months 2 and 3 and More than
rate amount 6 months and 1 year 3 years 4 years 5 years
%$m$m$m$m$m$m
31 December 2008
Cash and cash equivalents 0.0–2.8 (82) (82) ––––
Secured bank loans 6.177––––
Finance lease obligations* 9.7202––––202
Unsecured bank loans:
Euro floating rate 3.4224224––––
– effect of euro interest rate swaps* 1.8 – (105) – 105 – –
US dollar floating rate 1.5687687––––
– effect of US dollar interest rate swaps* 1.0 – (250) 100 – 150 –
Sterling floating rate 2.8152152––––
– effect of sterling interest rate swaps* 3.9 – (109) 109–––
HK dollar floating rate 2.98383––––
Net debt 1,273 607 209 105 150 202
* These items bear interest at a fixed rate.
Notes to the Group financial statements 81
GROUP FINANCIAL
STATEMENTS