Holiday Inn 2008 Annual Report Download - page 19
Download and view the complete annual report
Please find page 19 of the 2008 Holiday Inn annual report below. You can navigate through the pages in the report by either clicking on the pages listed below, or by using the keyword search tool below to find specific information within the annual report.-
 1
1 -
2
-
3
-
4
-
5
-
6
-
7
-
8
-
 9
9 -
 10
10 -
 11
11 -
 12
12 -
 13
13 -
 14
14 -
 15
15 -
 16
16 -
 17
17 -
 18
18 -
 19
19 -
 20
20 -
 21
21 -
 22
22 -
 23
23 -
 24
24 -
 25
25 -
 26
26 -
 27
27 -
 28
28 -
 29
29 -
30
-
31
-
32
-
33
-
34
-
35
-
36
-
37
-
38
-
39
-
40
-
41
-
42
-
43
-
44
-
45
-
46
-
47
-
48
-
49
-
50
-
51
-
52
-
53
-
54
-
55
-
56
-
57
-
58
-
59
-
60
-
61
-
62
-
63
-
64
-
65
-
66
-
67
-
68
-
69
-
70
-
71
-
72
-
73
-
74
-
75
-
76
-
77
-
78
-
79
-
80
-
81
-
82
-
83
-
84
-
85
-
86
-
87
-
88
-
89
-
90
-
91
-
92
-
93
-
94
-
95
-
96
-
97
-
98
-
99
-
100
-
101
-
102
-
103
-
104
-
105
-
106
-
107
-
108
 |
 |

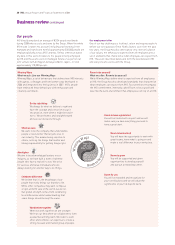
BUSINESS REVIEW
Business review 17
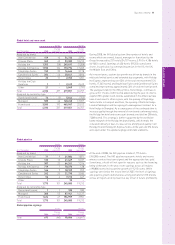
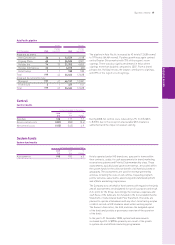
Central
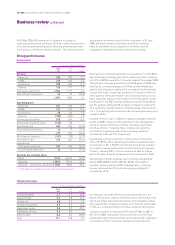
Central results
System funds
System fund results
12 months ended 31 December
2008 2007 %
$m $m change
Revenue 126 117 7.7
Gross central costs (281) (280) (0.4)
Net central costs (155) (163) 4.9
During 2008, net central costs reduced by 4.9% from $163m
to $155m due to the receipt of a favourable $3m insurance
settlement and the impact of weaker sterling.
12 months ended 31 December
2008 2007 %
$m $m change
Assessments 990 930 6.5 Hotels operated under IHG brands are, pursuant to terms within
their contracts, subject to cash assessments for brand marketing,
reservations systems and Priority Club membership stays. These
assessments, typically based upon room revenue, are pooled within
the system funds for the collective benefit of all hotels by brand or
geography. The assessments are used for revenue generating
activities including the costs of call centres, frequency program
points, websites, sales teams, advertising and brand development
and affiliate marketing programmes.
The Company acts on behalf of hotel owners with regard to the funds
and all assessments are designated for specific purposes and result
in no profit for the Group. Accordingly, the revenues, expenses and
cash flows of the funds are not included in the Consolidated Income
Statement or Consolidated Cash Flow Statement. The funds are
planned to operate at breakeven with any short-term timing surplus
or deficit carried on IHG’s balance sheet within working capital.
The Owners’ Association, the IAHI, endorses the budgeted spend
of the funds and provides a governance overview of the operation
of the funds.
In the year to 31 December 2008, system fund assessments
increased by 6.5% to $990m primarily as a result of the growth
in system size and affiliate marketing programmes.
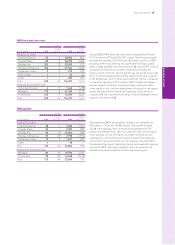
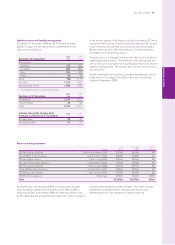
Asia Pacific pipeline
Hotels Rooms
Change Change
At 31 December 2008 over 2007 2008 over 2007
Analysed by brand
InterContinental 36 612,529 2,198
Crowne Plaza 65 924,535 3,507
Holiday Inn 74 25 21,205 6,835
Holiday Inn Express 23 16,015 (82)
Hotel Indigo 11180 180
Total 199 42 64,464 12,638
Analysed by ownership type
Managed 197 41 64,137 12,487
Franchised 21327 151
Total 199 42 64,464 12,638
The pipeline in Asia Pacific increased by 42 hotels (12,638 rooms)
to 199 hotels (64,464 rooms). Pipeline growth was again centred
on the Greater China market with 70% of the region’s room
signings. There was also significant demand in India, where
signings more than doubled compared to 2007. From a brand
perspective, Holiday Inn was the largest contributor to signings,
with 39% of the region’s room signings.