Holiday Inn 2008 Annual Report Download - page 48
Download and view the complete annual report
Please find page 48 of the 2008 Holiday Inn annual report below. You can navigate through the pages in the report by either clicking on the pages listed below, or by using the keyword search tool below to find specific information within the annual report.-
 1
1 -
2
-
3
-
4
-
5
-
6
-
7
-
8
-
9
-
10
-
11
-
12
-
13
-
14
-
15
-
16
-
17
-
18
-
19
-
20
-
21
-
22
-
23
-
24
-
25
-
26
-
27
-
28
-
29
-
30
-
31
-
32
-
33
-
34
-
35
-
36
-
37
-
 38
38 -
 39
39 -
 40
40 -
 41
41 -
 42
42 -
 43
43 -
 44
44 -
 45
45 -
 46
46 -
 47
47 -
 48
48 -
 49
49 -
 50
50 -
 51
51 -
 52
52 -
 53
53 -
 54
54 -
 55
55 -
 56
56 -
 57
57 -
 58
58 -
59
-
60
-
61
-
62
-
63
-
64
-
65
-
66
-
67
-
68
-
69
-
70
-
71
-
72
-
73
-
74
-
75
-
76
-
77
-
78
-
79
-
80
-
81
-
82
-
83
-
84
-
85
-
86
-
87
-
88
-
89
-
90
-
91
-
92
-
93
-
94
-
95
-
96
-
97
-
98
-
99
-
100
-
101
-
102
-
103
-
104
-
105
-
106
-
107
-
108
 |
 |

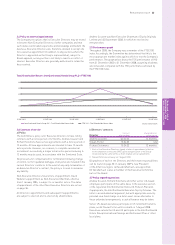
Long Term Incentive Plan (LTIP)
In 2008, there were three cycles in operation and one cycle which vested.
The awards made in respect of cycles ending on 31 December 2007, 2008, 2009 and 2010 and the maximum pre-tax number of ordinary
shares due if performance targets are achieved in full are set out in the table below. In respect of the cycle ending on 31 December 2008,
the Company finished in third place in the TSR group and achieved a relative cumulative annual growth rate (CAGR) of rooms of 4.9%.
Accordingly, 86.7% of the award will vest on 18 February 2009.
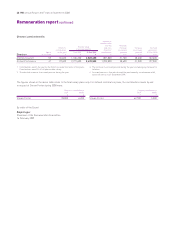
Maximum Maximum Expected
LTIP LTIP value value
shares shares based based
awarded vested on share on share
Maximum during Market during Market Actual/ Maximum price of price of
LTIP Awards the year price per the year price per Value at planned LTIP Awards 562p at 562p at
held at 1 Jan 2008 to Award share at 1 Jan 2008 to share at vesting vesting held at 31 Dec 2008 31 Dec 2008
Directors 1 Jan 2008 31 Dec 2008 date award 31 Dec 2008 vesting £ date 31 Dec 2008 £ £
Andrew Cosslett 276,200129.6.05 706p 152,738 827p 1,263,143 20.2.08 –
200,74023.4.06 941.5p – 18.2.09 200,740 1,128,159 978,1145
159,50632.4.07 1256p – 17.2.10 159,506 896,424
253,559419.5.08 854p – 16.2.11 253,559 1,425,001
Total 613,805 3,449,584
Stevan Porter 174,900129.6.05 706p 96,719 827p 799,866620.2.08 –
132,24023.4.06 941.5p 125,628 542.5p 681,53277.11.08 –
92,66732.4.07 1256p 17,811 542.5p 96,62577.11.08 –
147,209419.5.08 854p 28,029 542.5p 152,05777.11.08 –
Total –
Richard Solomons 176,550129.6.05 706p 97,632 827p 807,417 20.2.08 –
128,47023.4.06 941.5p – 18.2.09 128,470 722,001 625,9755
102,10932.4.07 1256p – 17.2.10 102,109 573,853
161,241419.5.08 854p – 16.2.11 161,241 906,174
Total 391,820 2,202,028
Former Directors
Richard Hartman 196,964129.6.05 706p 108,921 827p 900,777 20.2.08 –
85,23023.4.06 941.5p – 18.2.09 85,230 478,993 415,2875
28,43232.4.07 1256p – 17.2.10 28,432 159,788
Total 113,662 638,781
1 This award was based on performance to 31 December 2007 where the
performance measure related to both the Company’s TSR against a group
of seven other comparator companies and the CAGR of rooms in the IHG
system relative to a group of five other comparator companies. The number
of shares released is graded, according to a) where the Company finished in
the TSR comparator group, with 50% of the award being released for first or
second position and 10% of the award being released for median position;
and b) relative CAGR of rooms with 50% of the award being released for
3.4% (upper quartile) CAGR and 10% of the award being released for 2.4%
(median) CAGR. The Company finished in fourth place in the TSR group and
achieved a relative CAGR of 3.1%. Accordingly, 55.3% of the award vested
on 20 February 2008.
2 This award is based on performance to 31 December 2008 where the
performance measure relates to both the Company’s TSR against a group
of eight other comparator companies and the CAGR of rooms in the IHG
system relative to a group of eight other comparator companies. The
number of shares released is graded, according to a) where the Company
finished in the TSR comparator group, with 50% of the award being released
for first or second position and 10% of the award being released for median
position; and b) relative CAGR of rooms with 50% of the award being
released for 3.9% (upper quartile) CAGR and 10% of the award being
released for 3.3% (median) CAGR.
3 This award is based on performance to 31 December 2009 where the
performance measure relates to both the Company’s TSR against a group
of eight other comparator companies and the compound annual growth
rate in adjusted EPS over the performance period.
4 This award is based on performance to 31 December 2010 where the
performance measure relates to both the Company’s TSR relative to the
index and the compound annual growth rate in adjusted EPS over the
performance period.
5 The Company finished in third place in the TSR group and achieved
CAGR of rooms of 4.9%. Accordingly, 86.7% of the award will vest on
18 February 2009.
6 The value of Stevan Porter’s shares at vesting includes £96,953 that was
chargeable to UK Income Tax.
7 In accordance with Plan rules, Stevan Porter’s LTIP shares granted in 2006,
2007 and 2008 were pro-rated to reflect his contractual service during the
applicable performance periods. The Remuneration Committee calculated
the value of these entitlements as at 7 November 2008 at which point they
vested. The shares will be transferred to Mr Porter’s estate following
completion of UK probate in due course.
46 IHG Annual Report and Financial Statements 2008
Remuneration report continued